Gold (XAU/USD) managed to break above the previous top at $1,911 – dating back to September 2011. The new all-time high was created surprisingly easily with no real battle from the bears at the resistance area. Is there any direction but up at the moment?
Price Charts and Technical Analysis
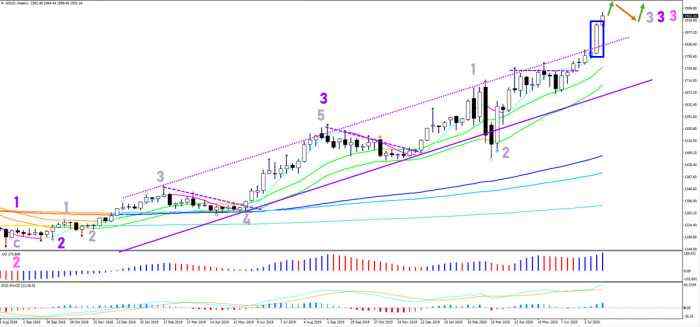
The weekly candlestick from last week closed extremely bullish (close near the high). But the candle was large as well indicating lots of volatility and momentum. It also clearly broke above the channel top and the previous top without any hesitation. The bullish price action seems to confirm the development of various waves 3 on the weekly chart. More upside is therefore likely, although some type of correction (flag or triangle) could place eventually.
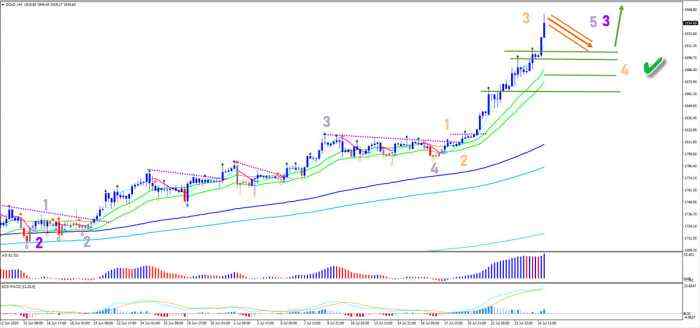
The 4 hour Gold chart shows how much bullish momentum the price swing is showing. The angle of the moving averages (MAs) are very steep and pull away significantly from the long-term MAs. This is typical for a wave 3 (orange) pattern and the momentum could push it higher. But as a trader, it might be better to wave for a wave 4 pattern back to support. A bounce at the support zone (green) is very likely at the moment.
Tuyên bố miễn trừ trách nhiệm: Quan điểm được trình bày hoàn toàn là của tác giả và không đại diện cho quan điểm chính thức của Followme. Followme không chịu trách nhiệm về tính chính xác, đầy đủ hoặc độ tin cậy của thông tin được cung cấp và không chịu trách nhiệm cho bất kỳ hành động nào được thực hiện dựa trên nội dung, trừ khi được nêu rõ bằng văn bản.

Để lại tin nhắn của bạn ngay bây giờ