· Views 662
On the daily chart, we can the Selling candles but dont be traped by the market, it's just a re-test candle after a long wave up. There 2 pin bars up we can see on the D1 chart here, that means we can BUY from there.
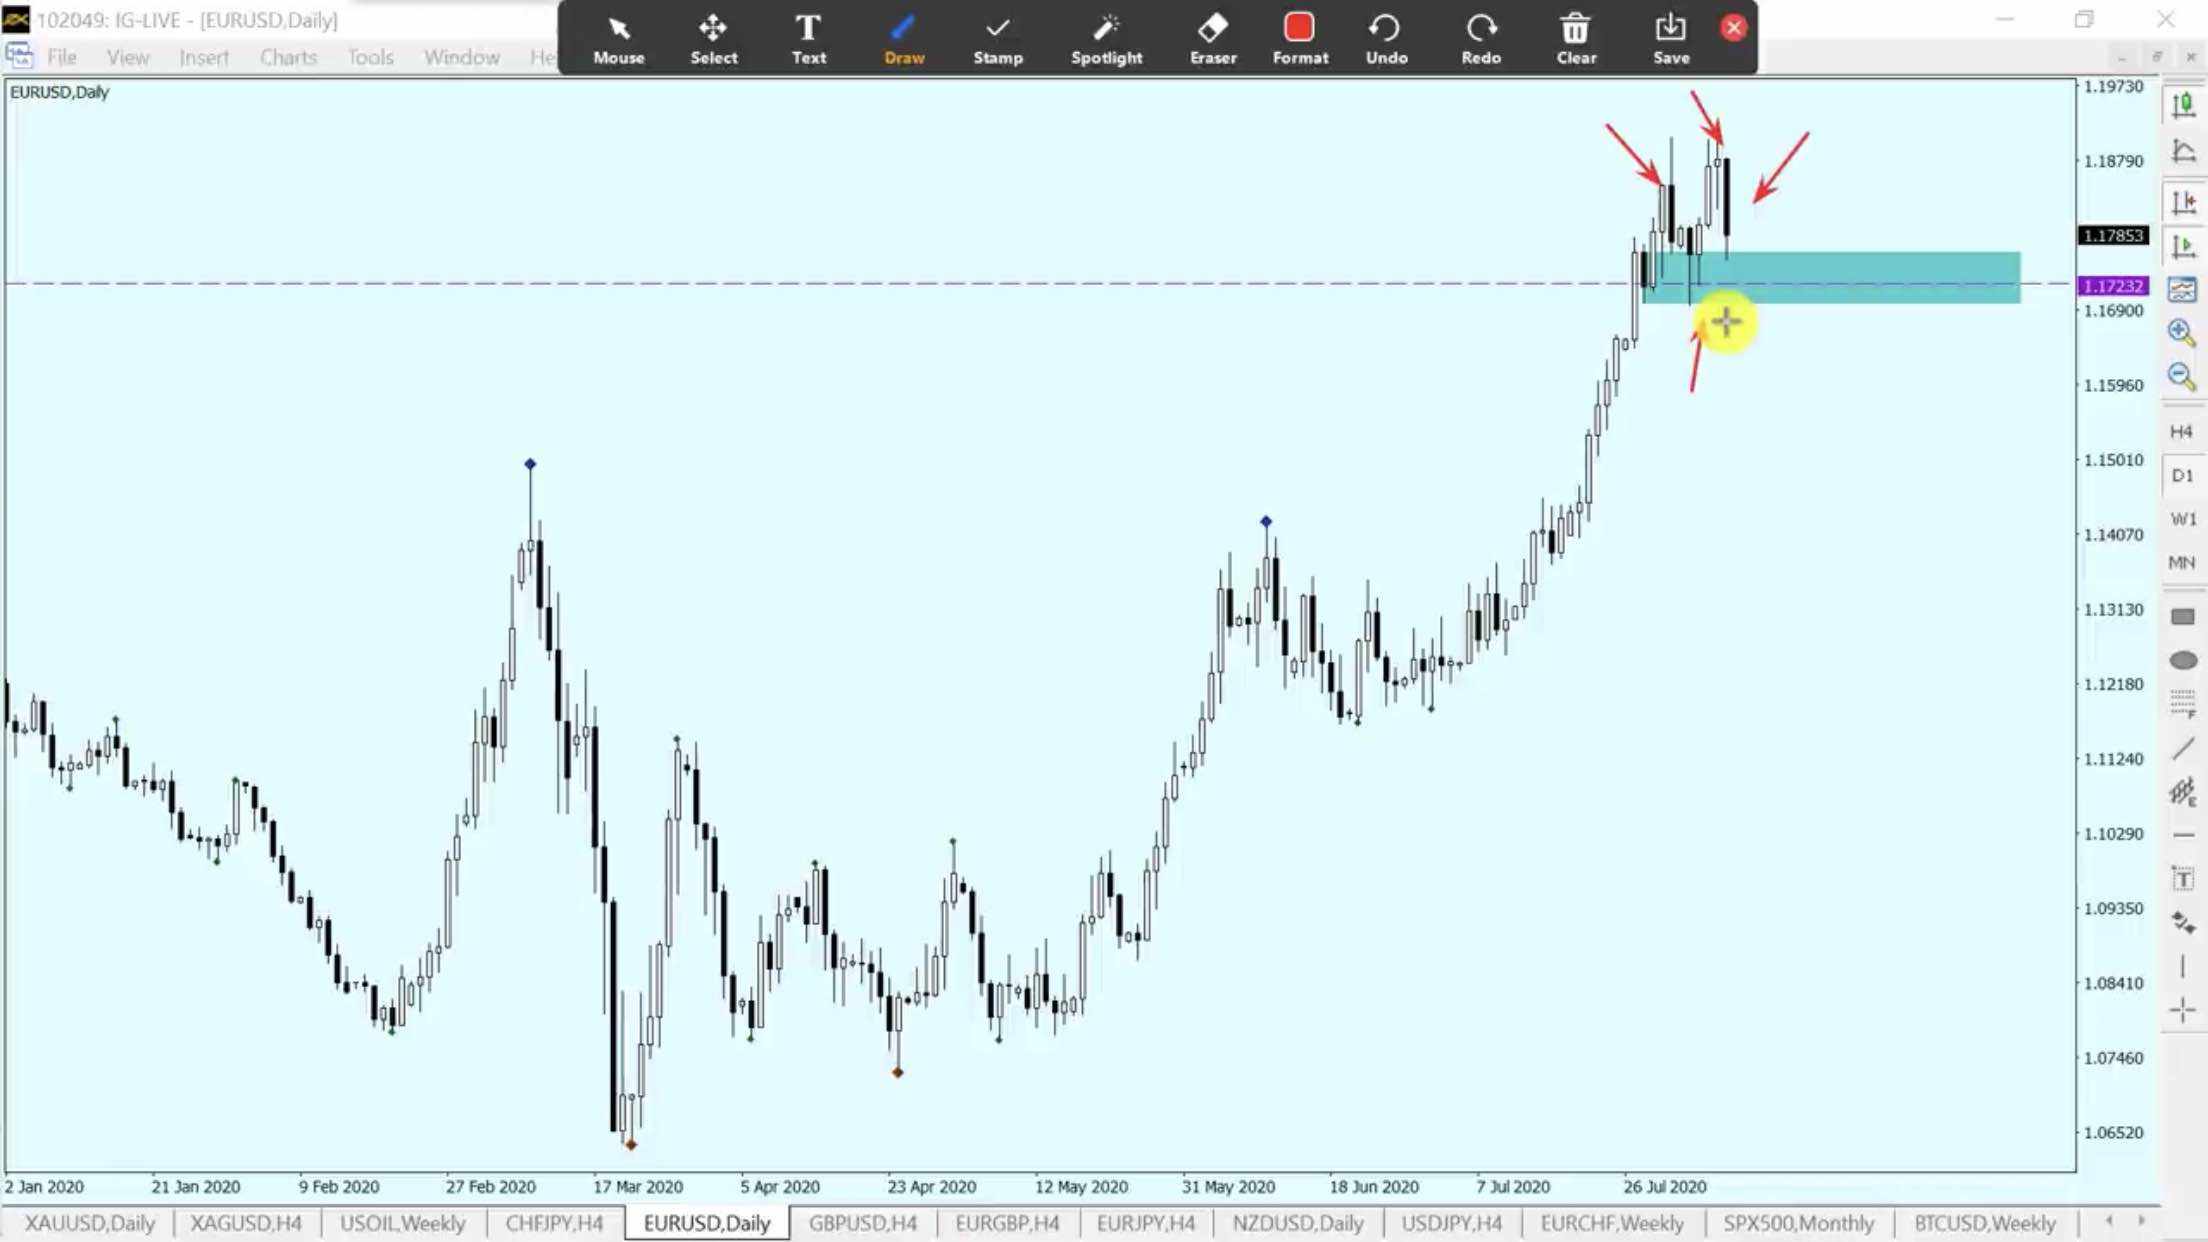
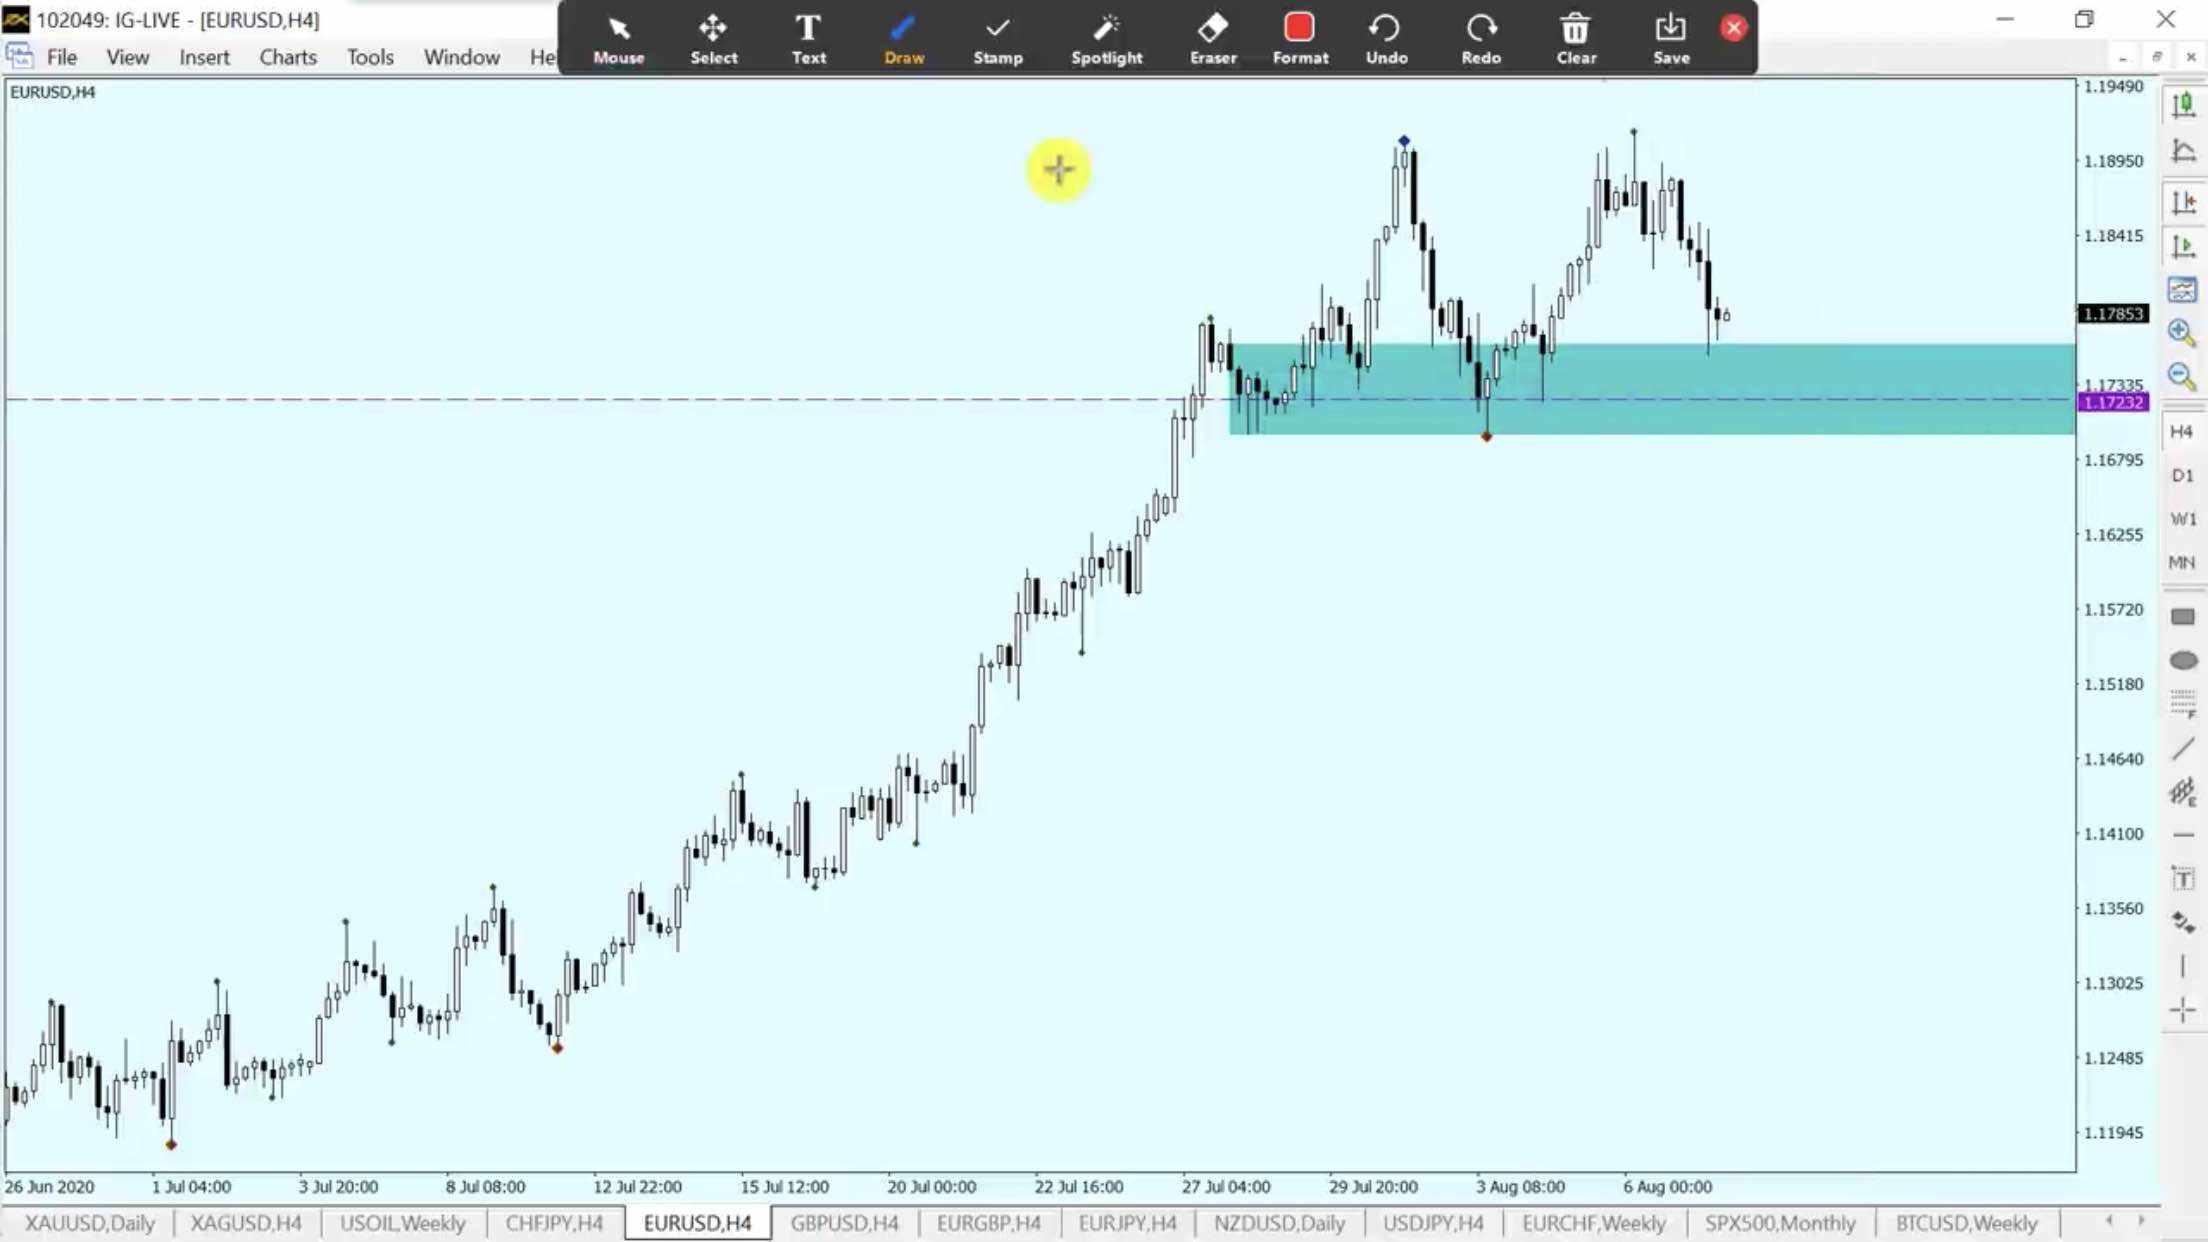
On the H4 chart, we can see clearly about the support area at the price 1.17232. Please wait for the price to arrive this area and a signal like pin bar up or inside bar to Buy.
Or you can BUY Limit at 1.17232, Stop loss at 1.16940, take profit at 1.1920 or 1.2000
This is my own opinion about the market, please always put stop loss to advoid risk.
Tuyên bố miễn trừ trách nhiệm: Quan điểm được trình bày hoàn toàn là của tác giả và không đại diện cho quan điểm chính thức của Followme. Followme không chịu trách nhiệm về tính chính xác, đầy đủ hoặc độ tin cậy của thông tin được cung cấp và không chịu trách nhiệm cho bất kỳ hành động nào được thực hiện dựa trên nội dung, trừ khi được nêu rõ bằng văn bản.
Bạn thích bài viết này? Hãy thể hiện sự cảm kích của bạn bằng cách gửi tiền boa cho tác giả.


Tải thất bại ()