EUR/USD price action has fluctuated within a broad 200-pip trading range after the major currency pair topped out at the 1.19-handle. The Euro still trades considerably higher relative to its US Dollar counterpart, currently up about 10% since EUR/USD based around the 1.08-price level three months ago, but the bloc currency has started to surrender some of those gains.
EUR/USD PRICE CHART: DAILY TIME FRAME (01 MAY TO 11 AUGUST 2020)

As Euro strength starts to ebb, which is indicated by the falling relative strength index, it seems that EUR/USD bulls are losing conviction. This follows a potential double top pattern at the 1.1900-mark. Spot EUR/USD price action now hovers below its downward-sloping 8-day moving average.
This technical barrier could suggest a bearish bias may be developing as the short-term trend starts to point lower. That said, interim technical support appears to align with month-to-date lows residing roughly around the 1.1700-handle before the medium-term 34-day moving average comes into focus as a potential downside target for EUR/USD bears.
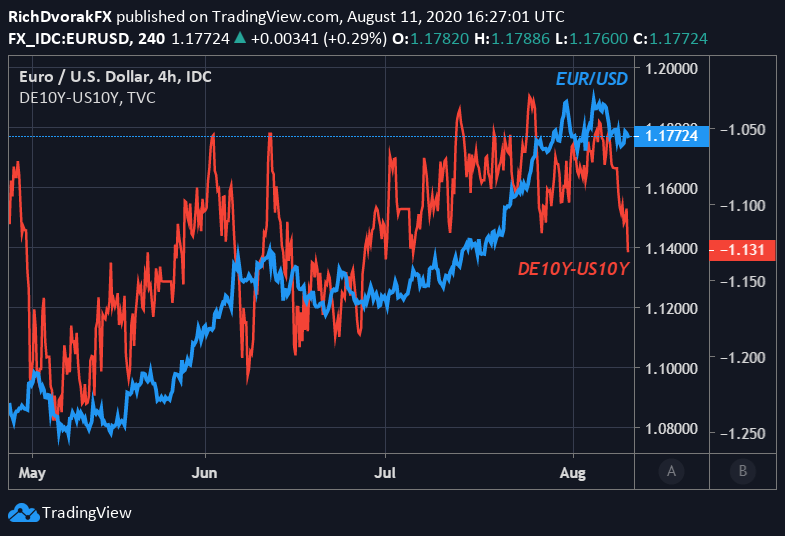
EUR/USD PRICE CHART: 4-HOUR TIME FRAME (29 APRIL TO 11 AUGUST 2020)
Reprinted from dailyfx, the copyright all reserved by the original author.
Tuyên bố miễn trừ trách nhiệm: Quan điểm được trình bày hoàn toàn là của tác giả và không đại diện cho quan điểm chính thức của Followme. Followme không chịu trách nhiệm về tính chính xác, đầy đủ hoặc độ tin cậy của thông tin được cung cấp và không chịu trách nhiệm cho bất kỳ hành động nào được thực hiện dựa trên nội dung, trừ khi được nêu rõ bằng văn bản.

Để lại tin nhắn của bạn ngay bây giờ