The EUR/USD is building a correction with lower highs and higher lows. Price action seems to be in a bearish ABC pattern within a bullish wave B. What are the key levels to consider?
Price Charts and Technical Analysis
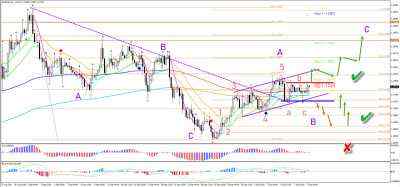
The EUR/USD support (blue line) and resistance (red line) levels are key for determining the next price swing. A bullish breakout above the resistance indicates a completed bearish ABC (red) within wave B (purple) and a continuation higher within the wave C (purple). The targets are the Fibonacci levels although the main Fib target is confluence of the -61.8% Fib and 78.6% Fib at 1.1925. A bearish breakout indicates a downside move towards the Fibonacci retracement levels of wave B (purple). This remains valid as long as price remains above the 100% Fibonacci level.The EUR/USD 1 hour chart is showing the current indecisiveness well. A bullish breakout above the resistance (red box) confirms a completed ABC (red). But a bearish breakout below the support (blue box) indicates that the waves B and C will shift forward (red arrows). The bulls are expected to keep control, either after the breakout or after a bounce at the Fibonacci retracement levels.

Reprinted from Fxempire,the copyright all reserved by the original author.
Tuyên bố miễn trừ trách nhiệm: Quan điểm được trình bày hoàn toàn là của tác giả và không đại diện cho quan điểm chính thức của Followme. Followme không chịu trách nhiệm về tính chính xác, đầy đủ hoặc độ tin cậy của thông tin được cung cấp và không chịu trách nhiệm cho bất kỳ hành động nào được thực hiện dựa trên nội dung, trừ khi được nêu rõ bằng văn bản.

Để lại tin nhắn của bạn ngay bây giờ