The Williams Percent Range, also called Williams %R, is a momentum indicator that shows you where the last closing price is relative to the highest and lowest prices of a given time period.
As an oscillator, Williams %R tells you when a currency pair might be “overbought” or “oversold.”
Think of it as a less popular and more sensitive version of Stochastic.
As a momentum indicator, it also gives RSI-like vibes in that it measures the strength of a current trend.
But while RSI uses its mid-point figure (50) to determine trend strength, traders use %R’s extreme levels (-20 and -80) for cues.
How to Trade Forex Using the Williams %R Indicator
Did you know that Stochastic and %R use the same formula to pinpoint the relative location of a currency pair?
The only difference is that Stochastic shows you a relative location by using the lowest price in a time range while %R uses the highest price to pinpoint the closing price’s position.
In fact, if you invert the %R line, it will have the EXACT SAME LINE as Stochastic’s %K line!This is why Williams %R uses the 0 to -100 scale while Stochastic is scaled from 0 to 100.
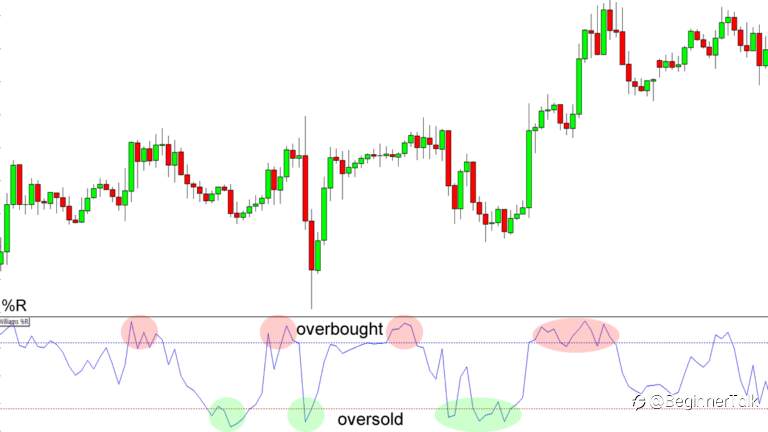
A reading above -20 is OVERBOUGHT.
A reading below -80 is OVERSOLD.
An overbought or oversold reading does NOT guarantee that the price will reverse.
All “overbought” means the price is near the highs of its recent range.
The same goes for oversold. All “oversold” means the price is near the lows of its recent range.
Determining Trend Strength Using %R
Williams %R’s sensitivity to volatile prices comes in handy when you want to know if prices are maintaining their bullish or bearish momentum.
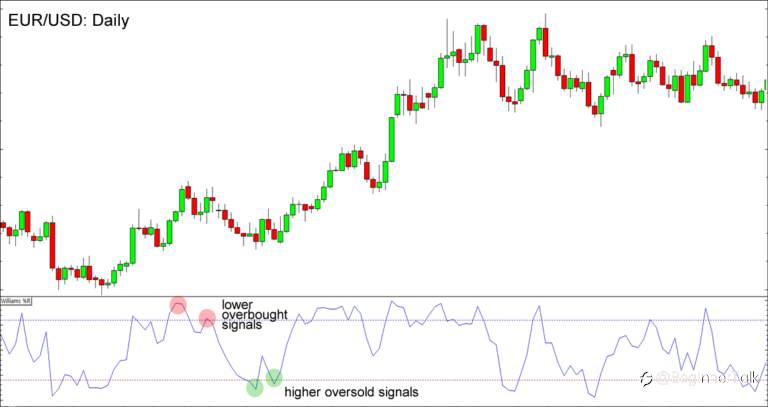
In EUR/USD’s daily chart below, you can see that the pair tried to extend its uptrend but failed to reach a new price and %R highs.
This means that prices aren’t hitting the high end of their range as quickly as they did before and that the bullish momentum might be running out of steam.In this case, the pair ended up dropping 200 pips in a week!
Almost immediately after that, the price gained enough bullish momentum to push %R above its oversold levels.
But although EUR/USD is still poppin’ up red candlesticks, they’re not enough to drag Williams %R back to its previous lows.
Another loss of momentum?Williams %R sure thought so!
Turned out, the bulls DID take over and pushed EUR/USD around 775 pips higher in less than 30 days.
Now that’s good oscillating right there. No wonder superfans call Williams %R as “The Ultimate Oscillator!”
Reprinted from Babypips,the copyright all reserved by the original author.
Đã chỉnh sửa 28 May 2021, 12:50
Tuyên bố miễn trừ trách nhiệm: Quan điểm được trình bày hoàn toàn là của tác giả và không đại diện cho quan điểm chính thức của Followme. Followme không chịu trách nhiệm về tính chính xác, đầy đủ hoặc độ tin cậy của thông tin được cung cấp và không chịu trách nhiệm cho bất kỳ hành động nào được thực hiện dựa trên nội dung, trừ khi được nêu rõ bằng văn bản.


Tải thất bại ()