While the broader market refrained from high volatility in the past 24-hours, Cosmos and Fantom eyed to retest their ATH level. Their near-term technicals chose the buyers. But both their CMFs could barely cross the equilibrium.
Similarly, Tron saw overbought readings on the Bolinger bands and saw a near-term pullback.
Tron (TRX)
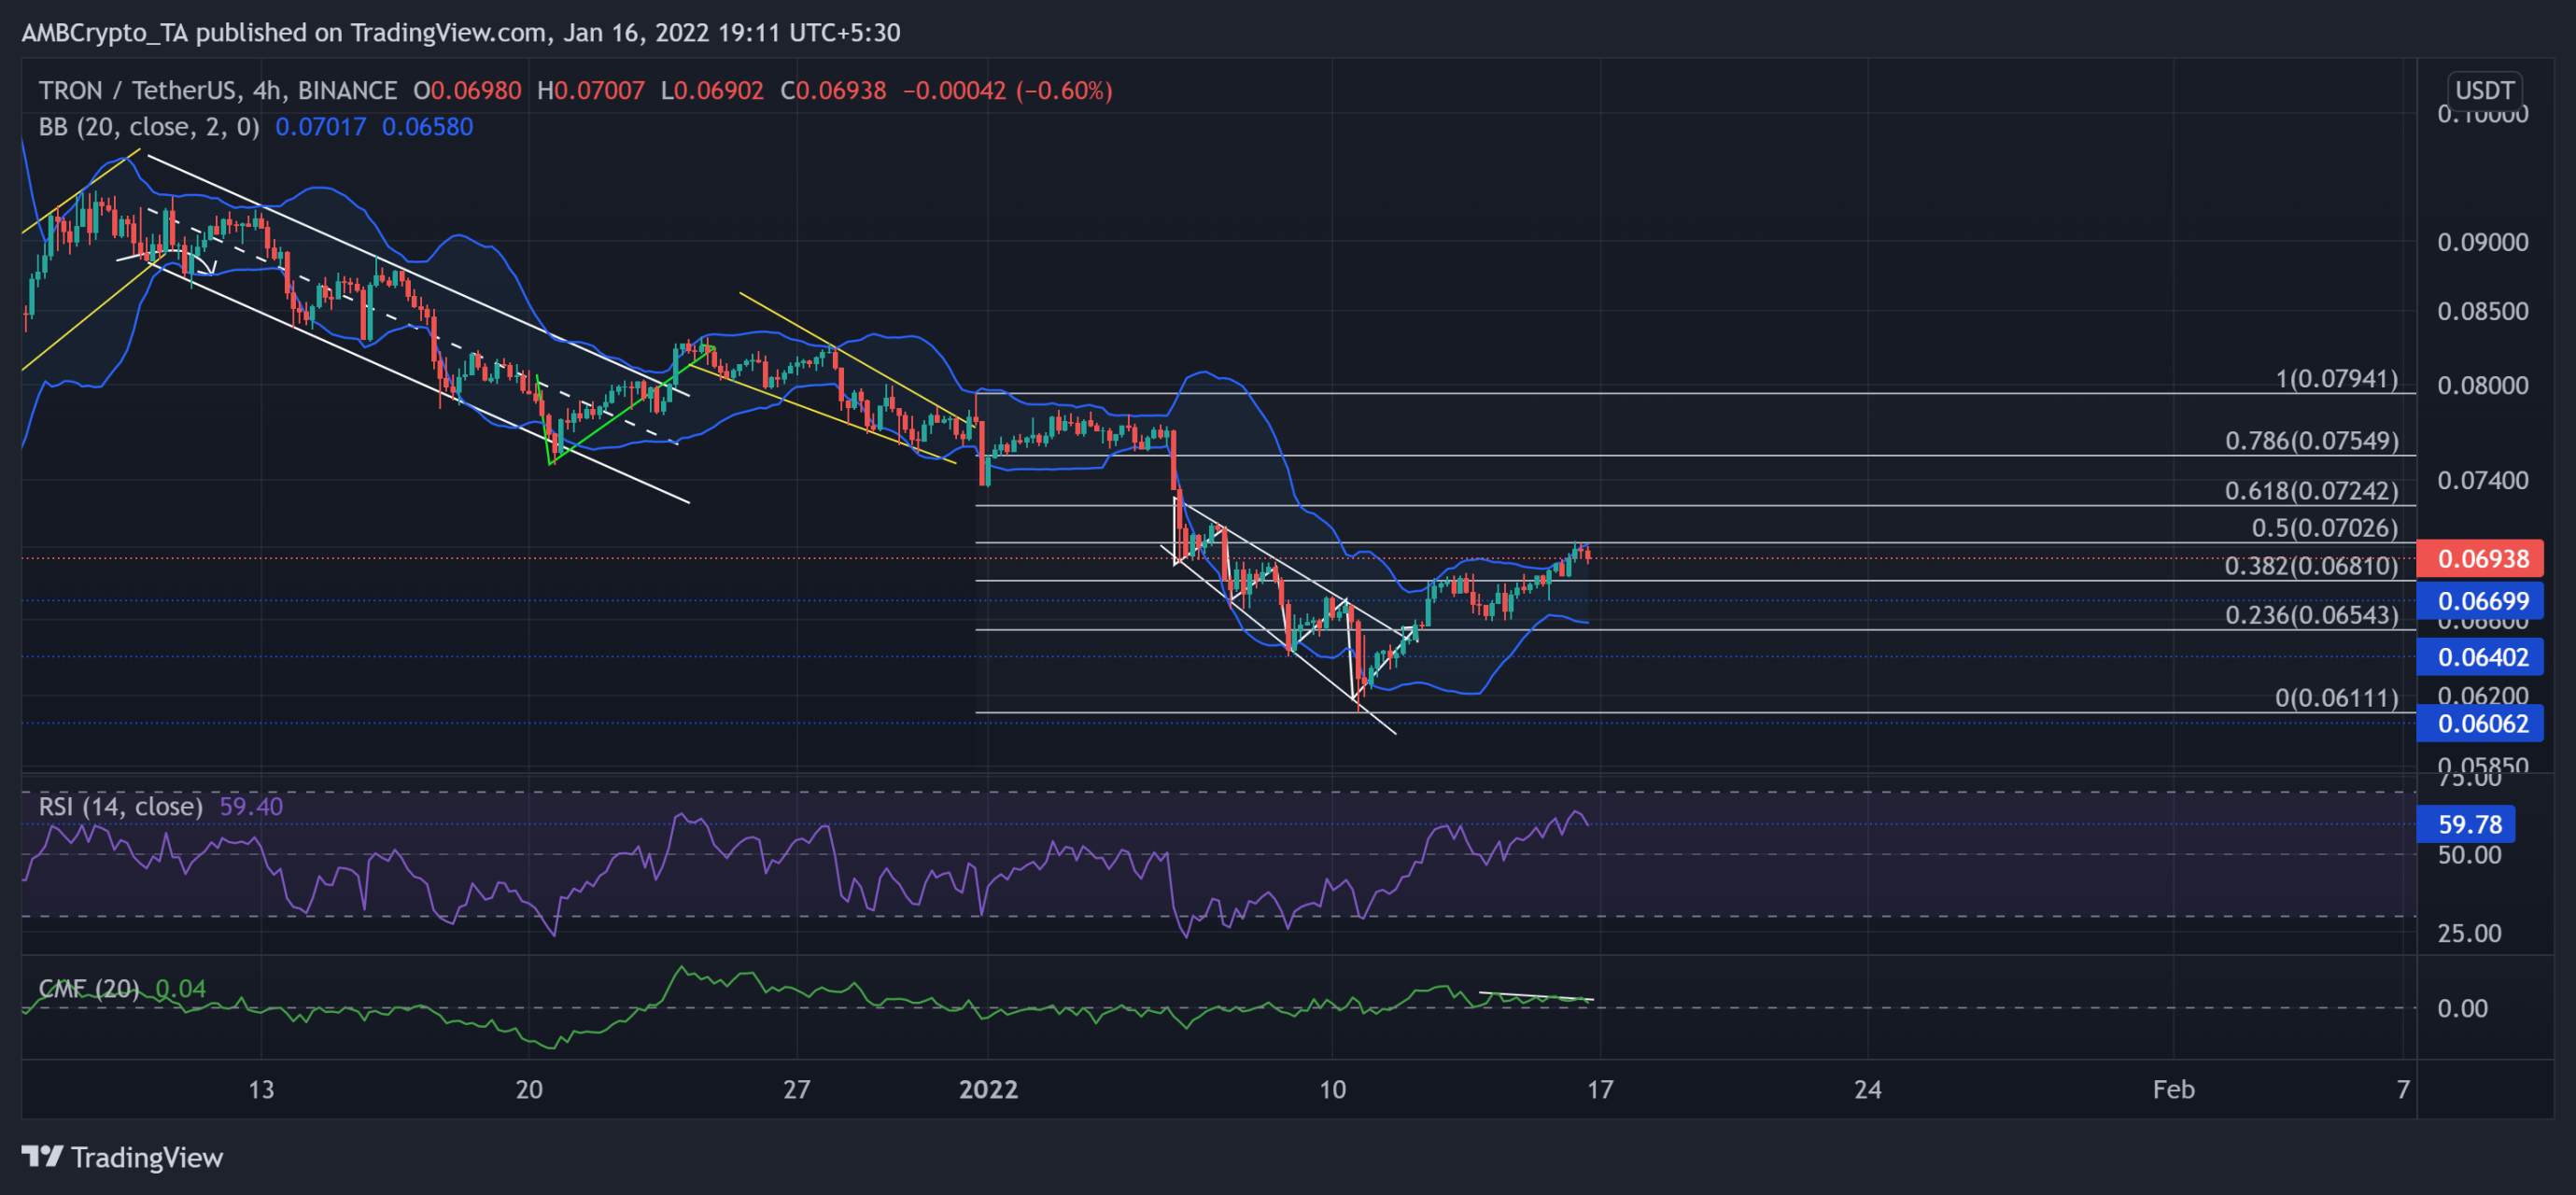
Source: TradingView, TRX/USDT
The buyers finally stepped in and initiated a patterned breakout after TRX poked its five-month low on 10 January. Since then, the alt grew by nearly 13.9% and found near-term resistance at the 38.2%, 50% Fibonacci level.
Now, the immediate resistance stood near the upper band of the Bollinger Bands. Although the bulls reclaimed the vital $0.0669-mark support, the CMF did not mark higher peaks and wavered near the zero-line. This reading meant the buying pressure could not correspond to the price increase.
At press time, TRX traded at $0.06938. After breaking out from the midline, the RSI finally crossed the 59-mark. But at the time of writing, it seemed to lose its vigor.
Cosmos (ATOM)
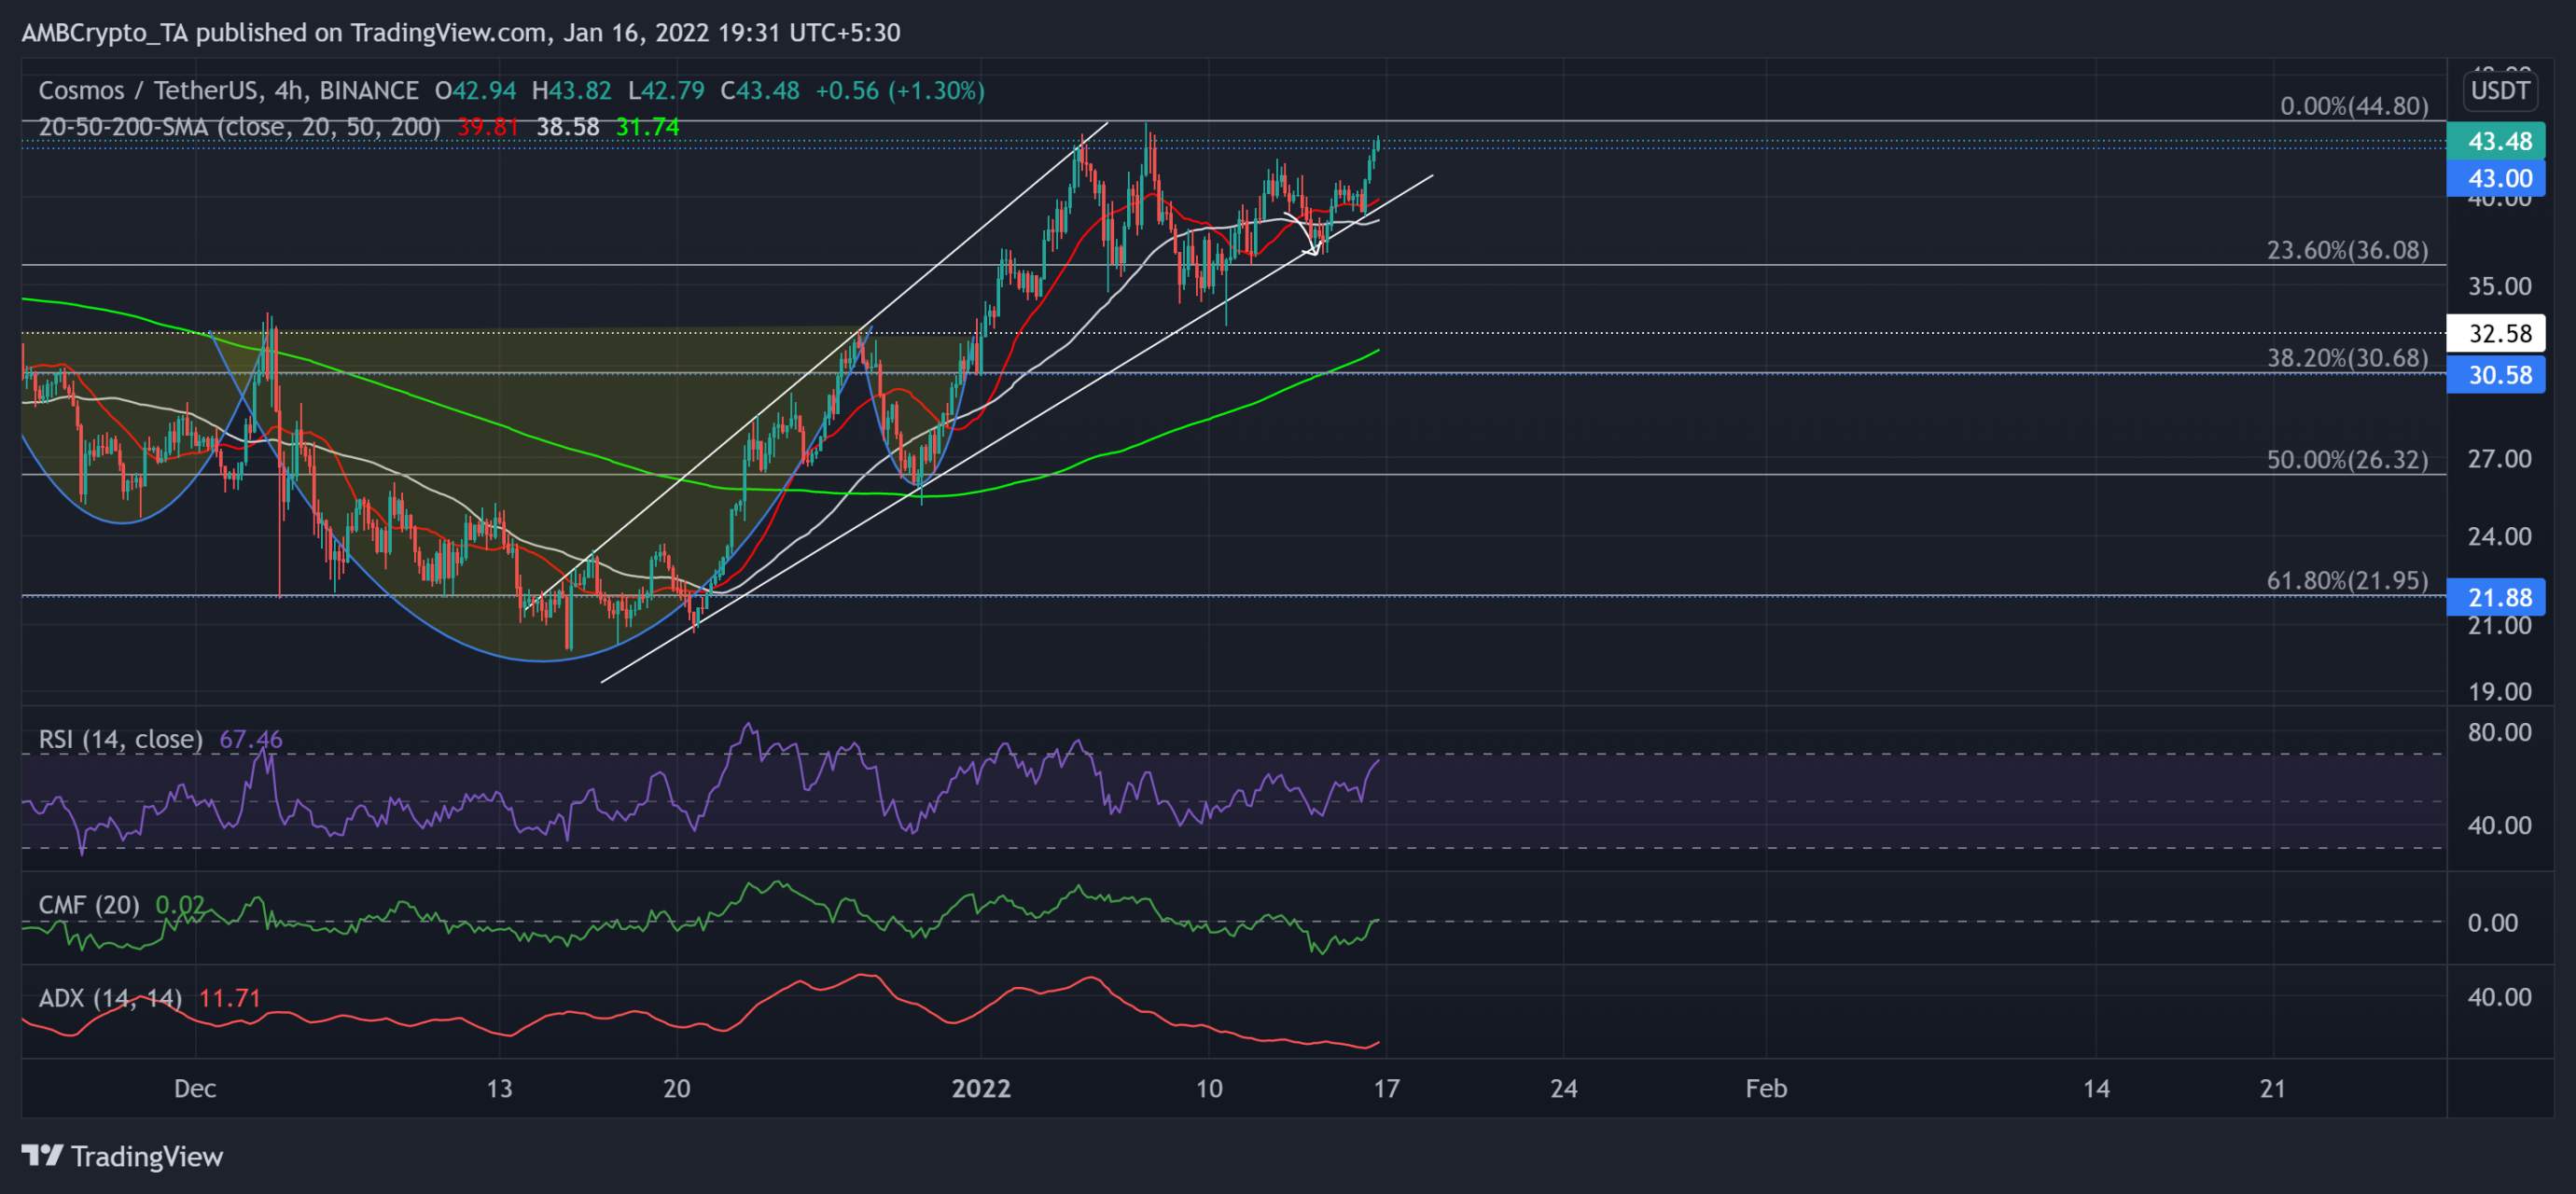
Source: TradingView, ATOM/USDT
After retesting the $32.5-support for over seven weeks, the bulls finally initiated a sustained inverse head and shoulder breakout on 1 January.
The alt jumped by over 35% (from 1 January) and poked its 15-week high on 7 January. This incline helped ATOM reclaim its long-term 23.6% Fibonacci support at the $36-mark.
The alt formed an ascending broadening wedge (reversal pattern, white) on its 4-hour chart over the past month. Now, as the 20-SMA (red) crossed its 50-200 SMA, ATOM depicted an increasing buying influence.
At press time, ATOM traded only 2.6% below its ATH at $43.48. The RSI flashed a bullish bias by consistently marking higher peaks. It now aimed to retest the overbought region. Interestingly, the CMF barely crossed the zero-line, indicating inadequate money flow. To top it up, the ADX displayed a weak directional trend.
Fantom (FTM)
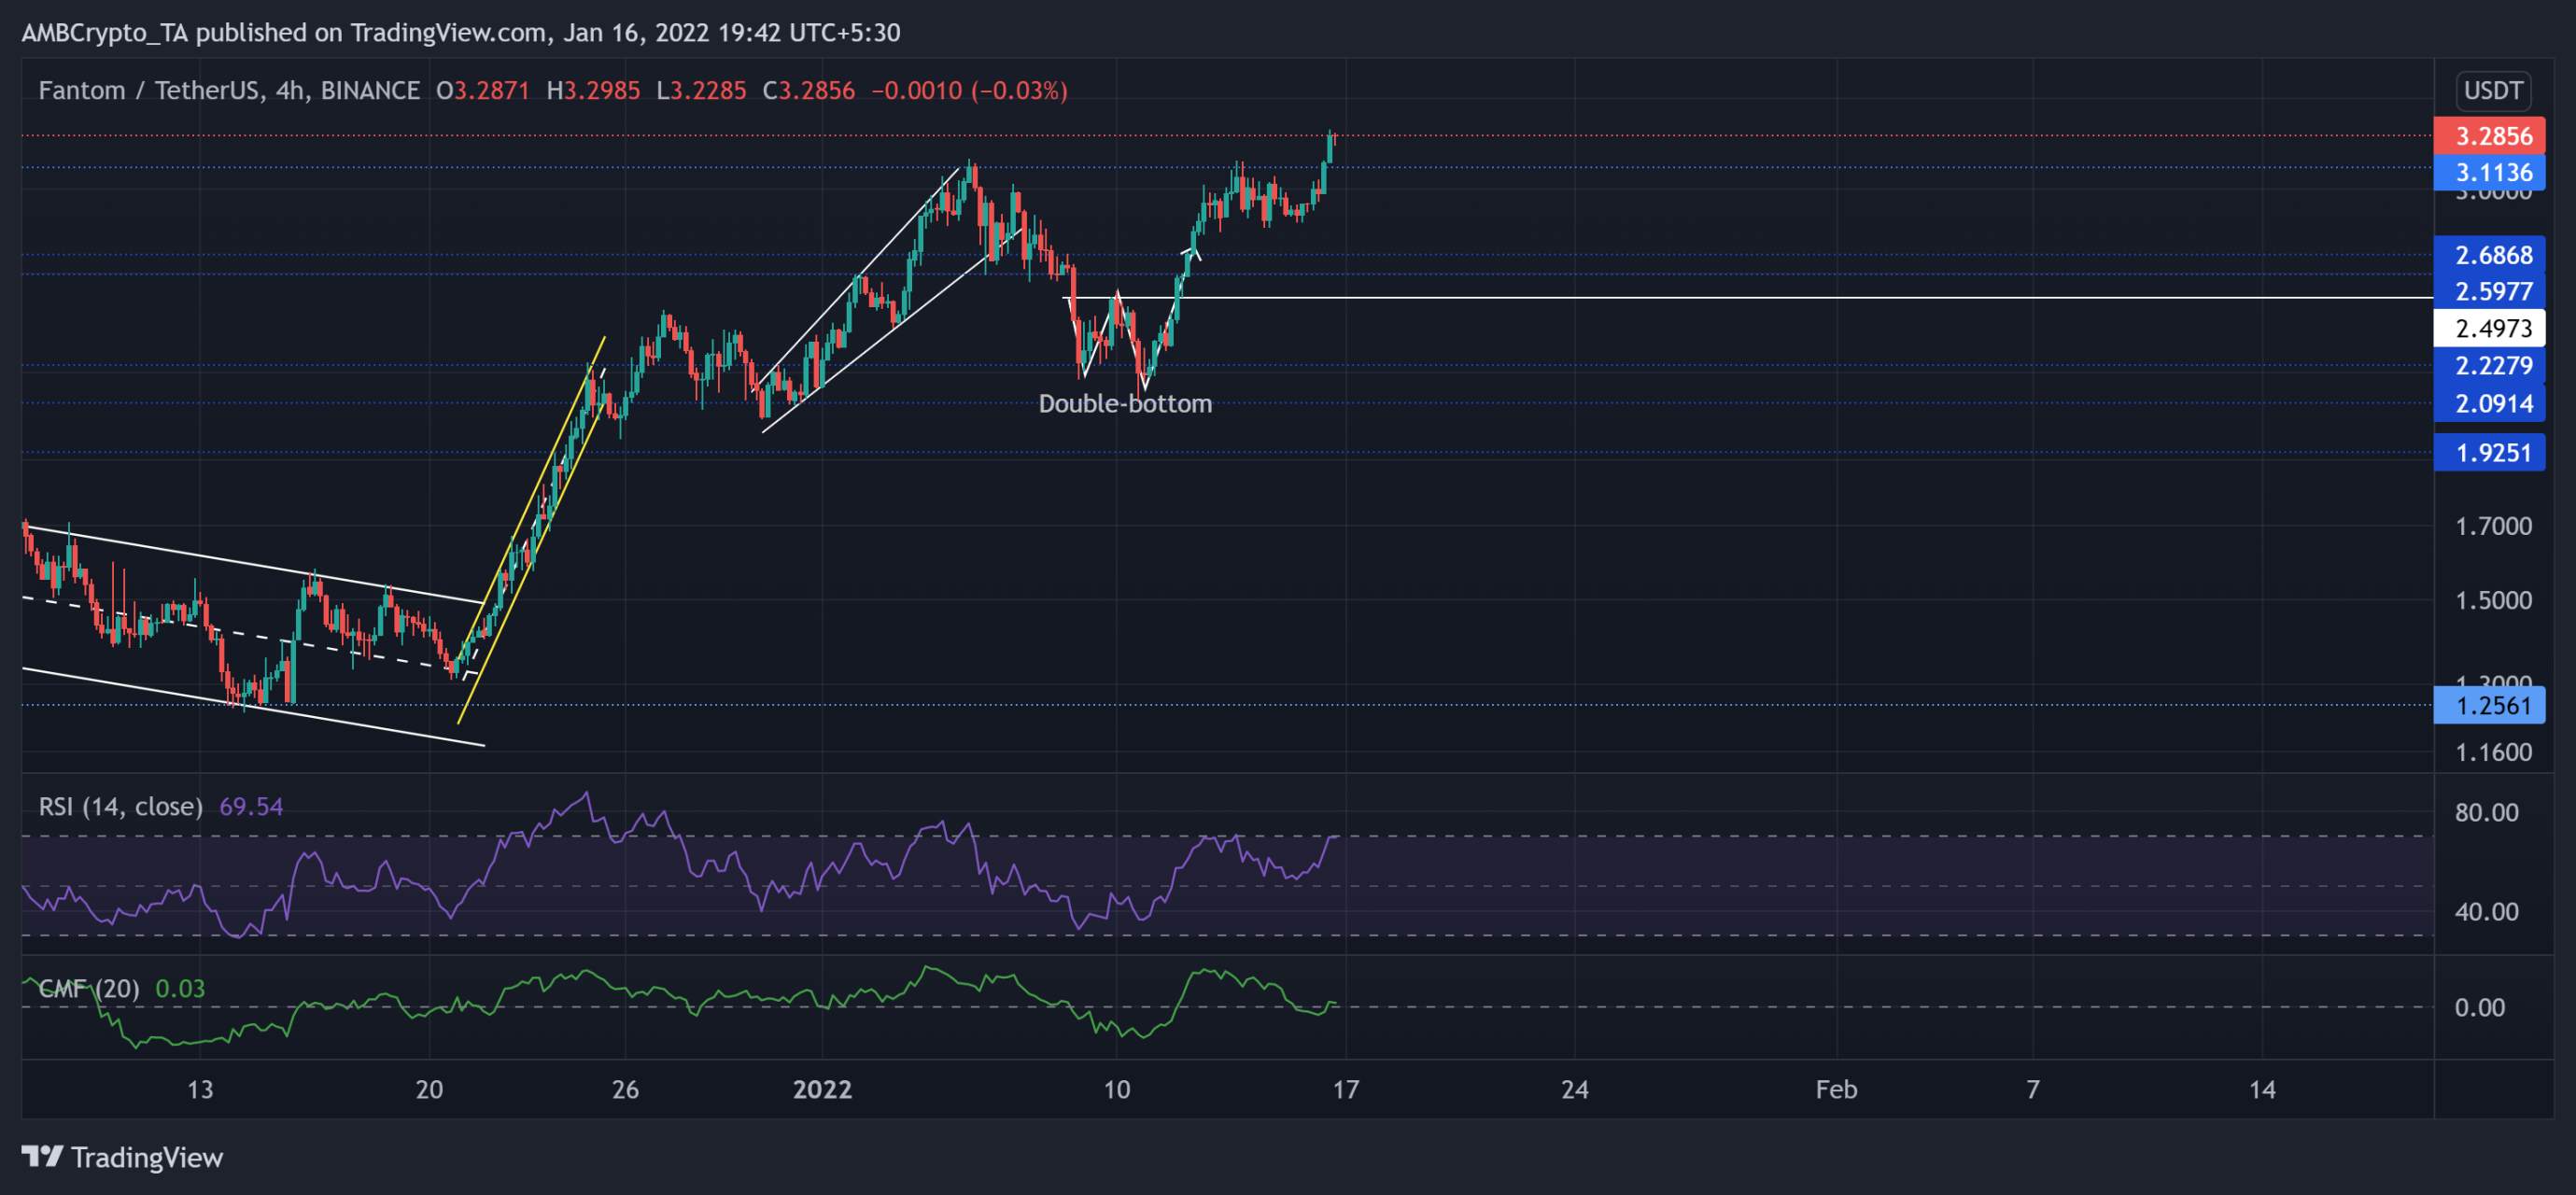
Source: TradingView, FTM/USDT
The ascending broadening wedge (white) saw a break down after FTM poked its two-month high on 5 January. Since then, the alt lost nearly 34.1% of its value to find testing grounds at the $2.22-mark.
From here, it recovered more than the value it lost after forming a classic double-bottom on its 4-hour chart. FTM gained a staggering 57.12% ROI from the 10 January low until press time.
At press time, FTM traded at $3.2856. The RSI surged by over 18 points over the past day moved near the overbought region. It displayed sideways tendencies before a possible reversal. Similar to ATOM, the CMF barely crossed the zero-line.
© ambcrypto. Copyright and all rights therein are retained by authors.
Tuyên bố miễn trừ trách nhiệm: Quan điểm được trình bày hoàn toàn là của tác giả và không đại diện cho quan điểm chính thức của Followme. Followme không chịu trách nhiệm về tính chính xác, đầy đủ hoặc độ tin cậy của thông tin được cung cấp và không chịu trách nhiệm cho bất kỳ hành động nào được thực hiện dựa trên nội dung, trừ khi được nêu rõ bằng văn bản.

Để lại tin nhắn của bạn ngay bây giờ