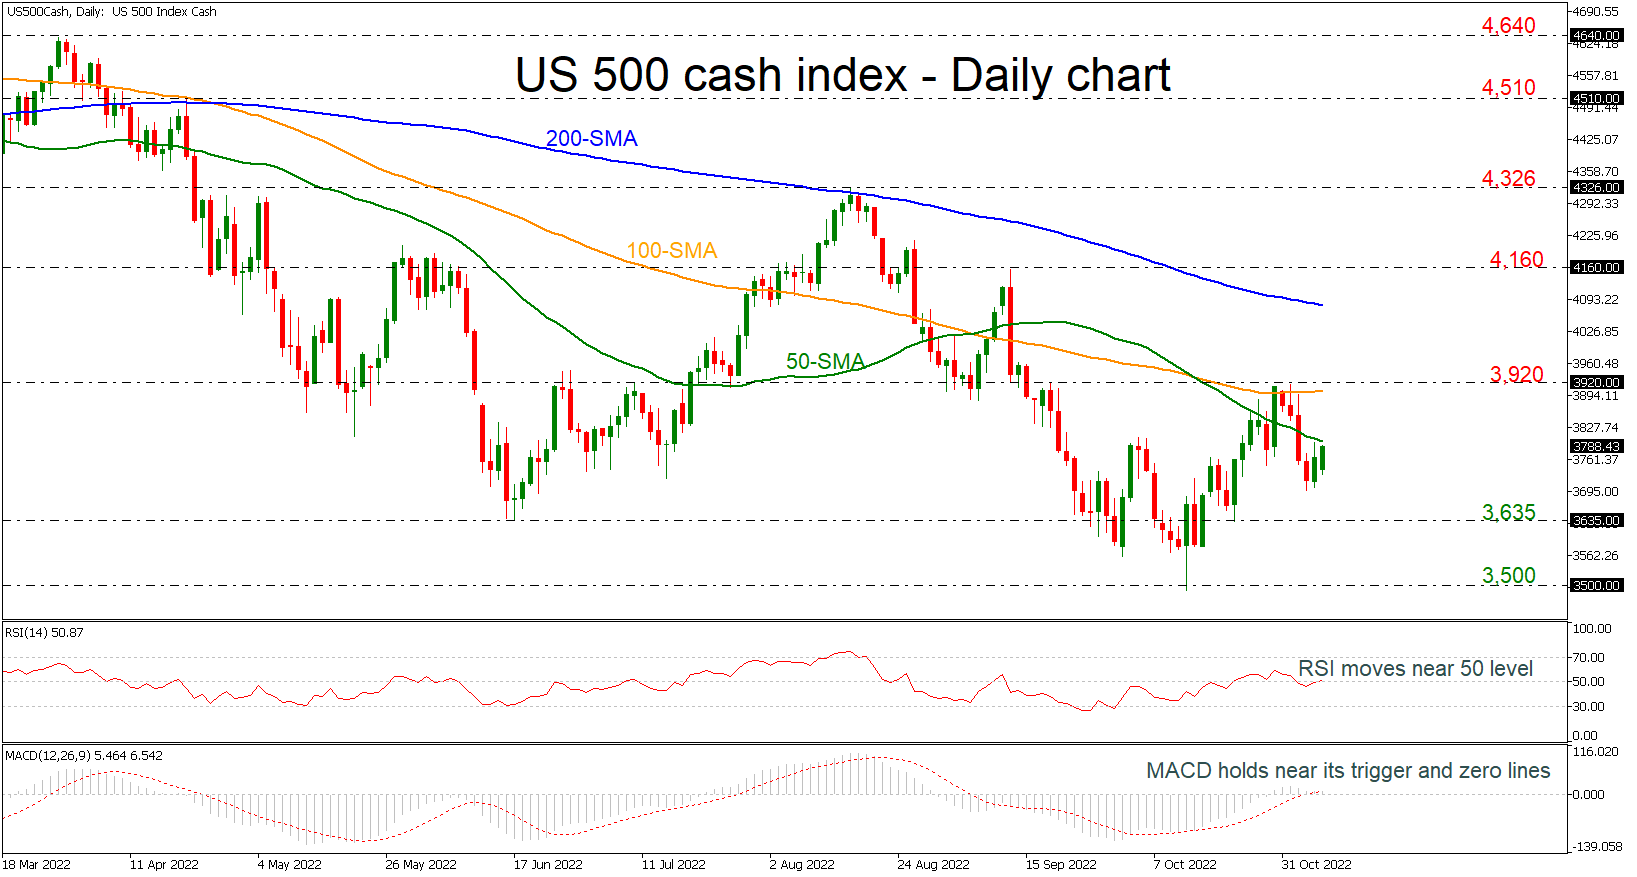
The US 500 stock index is moving slightly higher, approaching the 50-day simple moving average (SMA), holding well above the crucial 200-weekly SMA, which is acting as strong support level near 3,635. The RSI indicator is pointing slightly up near the neutral threshold of 50, while the MACD is moving sideways near its trigger and zero lines.
If price action jumps above the 50-day SMA (immediate resistance), there is scope to test the 100-day SMA around the 3,920 barrier. Clearing this key level would see additional gains towards the 200-day SMA at 4,080.
If the 3,635 support fails, then the focus would shift to the downside towards 3,500, which if breached would increase downside pressure and bring about a reversal of the trend. From here, the index would be on the path towards the 3,233 barrier, registered in October 2020.
Overall, the US 500 index has been negative in the long-term timeframe and only a climb above the 200-day SMA may change the outlook to bullish.
Tuyên bố miễn trừ trách nhiệm: Quan điểm được trình bày hoàn toàn là của tác giả và không đại diện cho quan điểm chính thức của Followme. Followme không chịu trách nhiệm về tính chính xác, đầy đủ hoặc độ tin cậy của thông tin được cung cấp và không chịu trách nhiệm cho bất kỳ hành động nào được thực hiện dựa trên nội dung, trừ khi được nêu rõ bằng văn bản.


Tải thất bại ()