· Views 1,998
We used the theory of price action in order to conduct this analysis, so that we could guide our decision-making process.
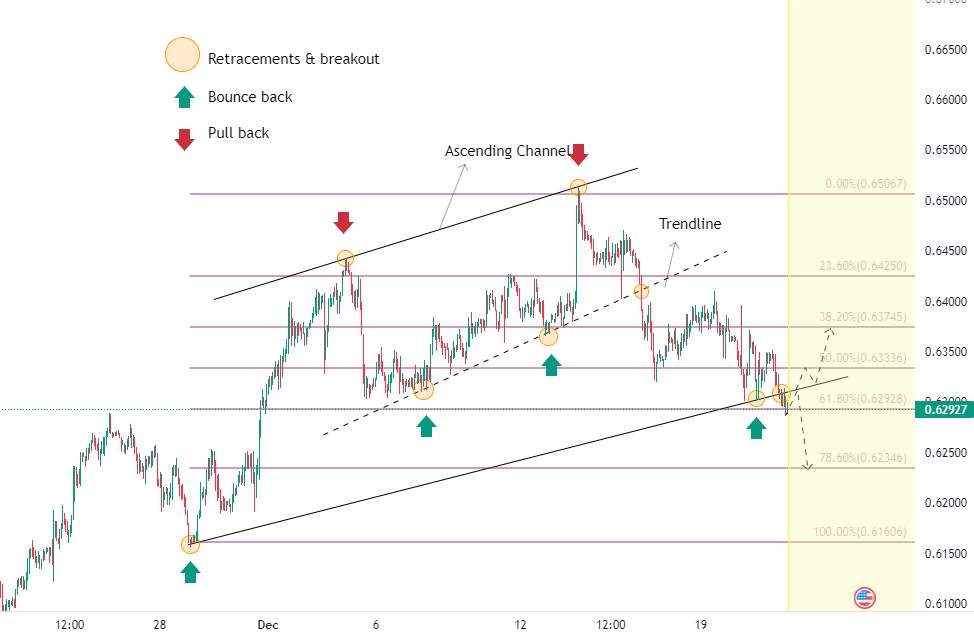
Based on the results of this analysis, we can see that the price is moving upwards while using the ascending channel to do so. In the past several months, the price has given us numerous pullbacks and bounce backs. In addition, the price has also tested the inner trend line in an attempt to complete the uptrend. However, near 0.64096, the price finally broke the inner trend line , giving us a short-term retracement, which gave us a new short-term downtrend. For more accuracy, we use Fibonacci levels. As of today, the price has already broken through the ascending channel and has held the support level of 0.62928 (61.80% of the Fibo). In the following days, we will be able to target the area where we can trade.
1.In the case of a price support moving down, the price is likely to move down and test the next support near 0.62928. If this support is broken, the price will enter a trend.
2.The target area near 0.63336 and 0.63745 is a retracement from the support area and a retest of the channel line; then price closes within the channel.
With this analysis, you will be able to find your most profitable trade, since Enclavefx believes in enhancing the knowledge of our clients & followers.
Tuyên bố miễn trừ trách nhiệm: Quan điểm được trình bày hoàn toàn là của tác giả và không đại diện cho quan điểm chính thức của Followme. Followme không chịu trách nhiệm về tính chính xác, đầy đủ hoặc độ tin cậy của thông tin được cung cấp và không chịu trách nhiệm cho bất kỳ hành động nào được thực hiện dựa trên nội dung, trừ khi được nêu rõ bằng văn bản.
Bạn thích bài viết này? Hãy thể hiện sự cảm kích của bạn bằng cách gửi tiền boa cho tác giả.

Để lại tin nhắn của bạn ngay bây giờ