· Views 2,211
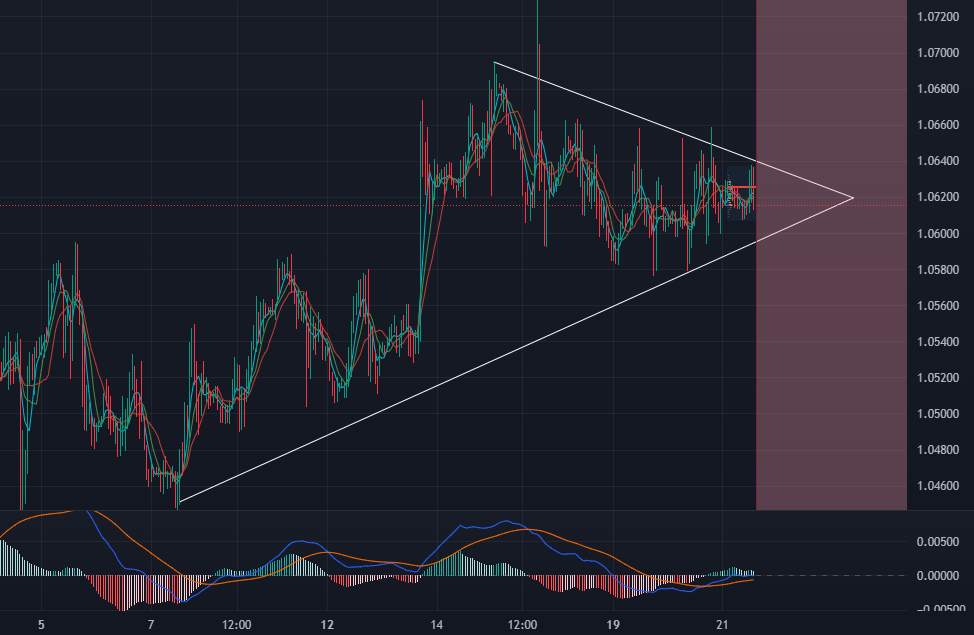
EUR vs USD created ascending triangle pattern in H1 timeframe. But we need compare it with the bigger timeframes also. In H4, EURUSD wanna break trendline and want to go downside. In Daily timeframe , it show us strong level between 1.0636 and 1.0776.
Now, what will think for further analysis? Let's research now.
Strong pattern is ascending triangle . It supports by breaking trend line in H4 also. This situation is a simple reminder for jumping up. But we should remember that EURUSD is high volatile pair and any fundamental or technical news can affect it positively or negatively.
In my opinion:
EURUSD will break trendline in H4, follow strong barrier in Daily timeframe . We can put:
SELL LIMIT at 1.0733
TARGET 1.0405
STOP LOSS 1.0805
or
SELL STOP at 1.0560
TARGET 1.0405
STOP LOSS 1.0743
These are only forecast. Do not forget to use SL in own trading. Trading without stop loss and bigger lots can cause heavy losses.
Good luck!
Tuyên bố miễn trừ trách nhiệm: Quan điểm được trình bày hoàn toàn là của tác giả và không đại diện cho quan điểm chính thức của Followme. Followme không chịu trách nhiệm về tính chính xác, đầy đủ hoặc độ tin cậy của thông tin được cung cấp và không chịu trách nhiệm cho bất kỳ hành động nào được thực hiện dựa trên nội dung, trừ khi được nêu rõ bằng văn bản.
Bạn thích bài viết này? Hãy thể hiện sự cảm kích của bạn bằng cách gửi tiền boa cho tác giả.

Để lại tin nhắn của bạn ngay bây giờ