*XAU/USD(Gold) Analysis*
*Previous Trading Session*
• On Wednesday, gold ended the day in a bearish territory (at 2031.25) and fell around 9 points from the opening at 2040.
• However, it could not give a close below 2029.72, our previously mentioned support level.
*Current Situation*
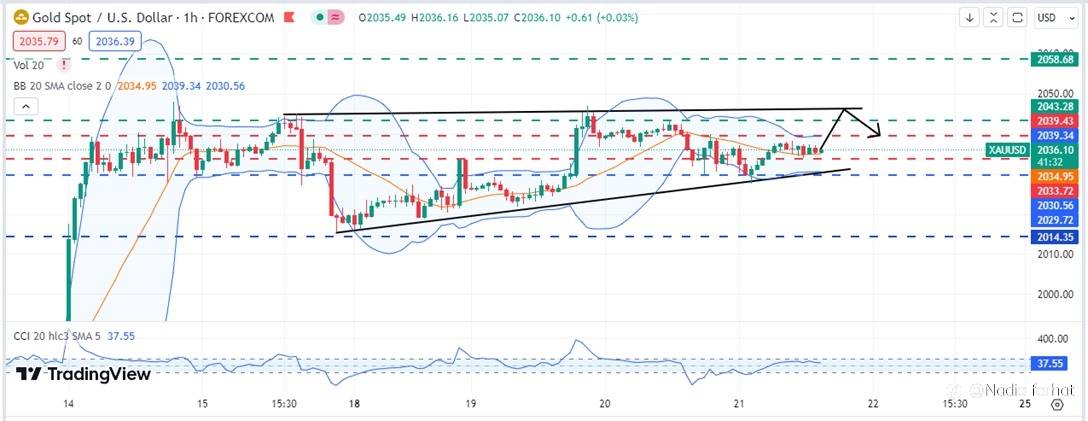
• Gold rebounded after testing the lower trend line of the triangle and looked strong in Thursday’s Asian Session.
• Gold currently consolidating in a narrow range between 2035.32 & 2039.43 and looks directionless.
• Although, gold seems to be sustaining above the key support of 2035.32, which was previously acting as resistance
*Analysis*
• The gold seems to be driven by the weakness in US dollar.
• The 10-year U.S. Treasury yield on Wednesday hit its lowest level since July. The yield on the benchmark 10-year Treasury note fell 7 basis points to 3.849%. On July 27, the 10-year yielded as low as 3.839%.
• Further, Sticky inflation in the Euro Zone raises the probability of further rate hikes, which has negatively impacted dollar prices.
• Safe-haven demand for gold increased amid a significant selloff in equities, and due to the escalation of terrorist activities in the Red Sea – a major maritime trade route.
*Technical Indicators:*
• Gold is currently trending with uncertainty as per technical indicators.
• Gold on Thursday hovers exactly at the middle band of the Bollinger Band as visible on the attached H4 chart.
• The CCI levels also hovers in the very close to 0.0 level near 1.37 levels.
*Projection:*
• Nothing has changed for Gold and it still looks uncertain, hence, take your trades very cautiously.
• The choppy movement will continue till the US session, in which important GDP, Initial Jobless Claims, and Philadelphia Fed Manufacturing Index are going to be released.
*Important Levels to Watch*
*It is noteworthy that our previously given levels during late November are still respected by the gold prices – as visible on the attached H4 chart of Gold*
• Resistance: A bullish acceptance above 2039.43 is very important for the Gold price to resume its journey higher toward the crucial 2072 level.
• Support: To begin a declining trend, it is important that gold gives a daily closing below 2033.72. Below it a correction mode will begin with the next support at 2018.00
#XAU/USD# #gold# #GOLDTODAY# #CrazyGold# #Todayanalysis# #analysis# #technicalanalysis# #fundamentalsanalysis# #Commodities# #preciousmetal# #forexmarket# #forextrading# #forextraders# #ForexToday#
Tuyên bố miễn trừ trách nhiệm: Quan điểm được trình bày hoàn toàn là của tác giả và không đại diện cho quan điểm chính thức của Followme. Followme không chịu trách nhiệm về tính chính xác, đầy đủ hoặc độ tin cậy của thông tin được cung cấp và không chịu trách nhiệm cho bất kỳ hành động nào được thực hiện dựa trên nội dung, trừ khi được nêu rõ bằng văn bản.

Để lại tin nhắn của bạn ngay bây giờ