*Previous Trading Session*
• On Tuesday, Gold price extended its daily uptrend and rose to a fresh multi-week high above $2,060.
• The benchmark 10-year US Treasury bond yield stays in negative territory below 3.9% after soft US PCE inflation data, allowing XAU/USD to gather bullish momentum.
*Current Situation*
• The gold has shown a strong bullish momentum during Tuesday’s early Asian Session, despite the steady US dollar.
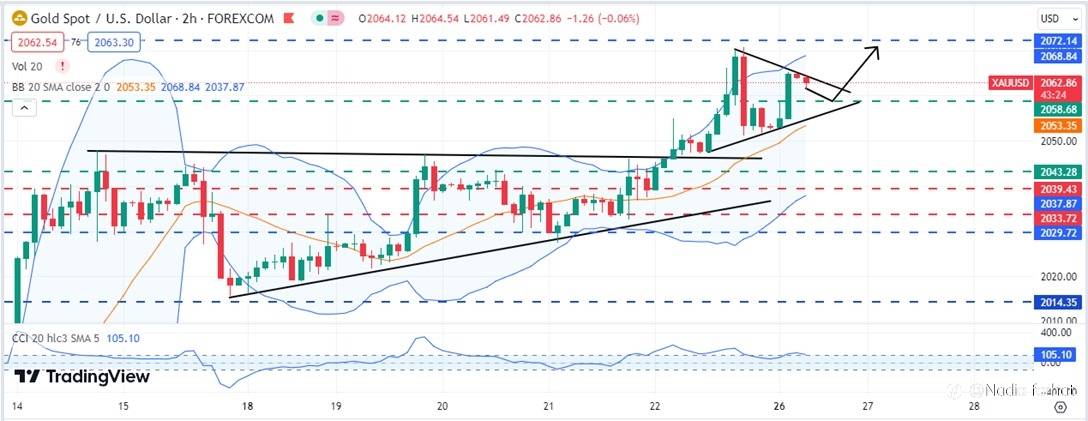
• Gold extended the previous week’s strength and it retested the upper trend line of the symmetrical triangle pattern as the day began on Tuesday post-Christmas Holiday.
• Gold currently consolidating at the upper trend line of the triangle pattern – signaling further bullishness. However, it is crucial for gold to give a higher breakout out of the triangle to test higher resistance levels.
• Currently XAU/USD is hovering near 2064.88
*Analysis*
• The gold seems to be driven by the weakness in US dollar.
• The 10-year U.S. Treasury yield on Wednesday hit its lowest level since July. The yield on the benchmark 10-year Treasury note fell 7 basis points to 3.849%. On July 27, the 10-year yielded as low as 3.839%.
• Further, Sticky inflation in Euro Zone raise probabilities of further rate hikes, which has negatively impact dollar prices.
• Safe-haven demand for gold increased amid a significant selloff in equities, and due to the escalation of terrorist activities in Red Sea – a major maritime trade route.
*Technical Indicators:*
• Gold continues to trend in the bullish zone as per technical indicators.
• Gold on Tuesday hovers above the middle band of the Bollinger Band as visible on the attached H4 chart.
• The CCI levels also lies above the 0.0 level near 112 levels.
• As per the technical indicators, the prices are expected to take a minor correction before resuming its bullish trajectory.
*Important Levels to Watch*
• Resistance: A bullish acceptance above the symmetrical triangle pattern, intraday highs of 2065.15 will drag prices till the 2095 level. Above which, gold price to resume its journey higher toward a new all-time high level.
• Support: To begin a declining trend, it is important that gold gives a daily closing below 2058.68. Below the correction mode will begin with the next support at 2043.29.
#XAU/USD# #gold# #GOLDTODAY# #ChinaGold# #ForexForecast# #Todayanalysis# #analysis# #technicalanalysis# #fundamentalsanalysis# #AnalisisFundamental# #trading# #forextrading# #BeginnerTrader# #NewTraders#
Tuyên bố miễn trừ trách nhiệm: Quan điểm được trình bày hoàn toàn là của tác giả và không đại diện cho quan điểm chính thức của Followme. Followme không chịu trách nhiệm về tính chính xác, đầy đủ hoặc độ tin cậy của thông tin được cung cấp và không chịu trách nhiệm cho bất kỳ hành động nào được thực hiện dựa trên nội dung, trừ khi được nêu rõ bằng văn bản.

Để lại tin nhắn của bạn ngay bây giờ