| Scenario | |
|---|---|
| Timeframe | Weekly |
| Recommendation | SELL STOP |
| Entry Point | 333.90 |
| Take Profit | 321.42, 299.02 |
| Stop Loss | 342.13 |
| Key Levels | 299.02, 321.42, 333.95, 350.32, 364.05, 384.77 |
| Alternative scenario | |
|---|---|
| Recommendation | BUY STOP |
| Entry Point | 350.35 |
| Take Profit | 364.05, 384.77 |
| Stop Loss | 342.13 |
| Key Levels | 299.02, 321.42, 333.95, 350.32, 364.05, 384.77 |
Home Depot Inc., H4
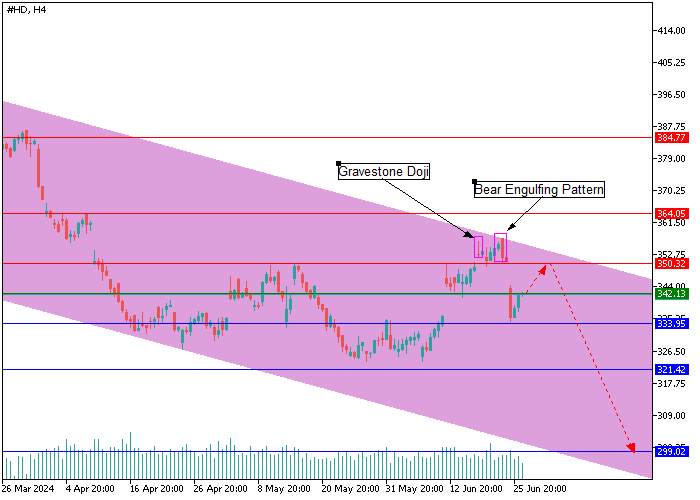
On the four-hour chart, shares of The Home Depot Inc., the largest home improvement company, are forming reversal candlestick analysis patterns Gravestone Doji and Bear Engulfing Pattern at the resistance level of 350.32, after which a price gap formed, and the asset fell to 333.95. At the moment, the price is holding at 342.13, trying to close the gap, after which the negative dynamics may continue to 333.95, after consolidation below which short positions, with the targets around 321.42–299.02, are relevant. In case of recovery of the quotes above the key resistance level of 350.32, the asset growth may reach 364.05–384.77.

Home Depot Inc., D1
A reversal Bear Engulfing Pattern formed on the daily chart at 350.32, after which the price dropped to the key support level of 333.95. A Bear Harami pattern formed near 342.13, emphasizing the weakness of the “bulls.” Most likely, the quotes will reach 333.95, and the breakdown will strengthen the negative dynamics around 321.42–299.02.

Support and resistance
Resistance levels: 350.32, 364.05, 384.77.
Support levels: 333.95, 321.42, 299.02.
Trading tips
Short positions may be opened below 333.95, with the targets at 321.42, and 299.02. Stop loss — 342.13. Implementation period: 7 days or more.
Long positions may be opened above 350.32, with the targets of 364.05, and 384.77. Stop loss — 342.13.
风险提示:以上内容仅代表作者或嘉宾的观点,不代表 FOLLOWME 的任何观点及立场,且不代表 FOLLOWME 同意其说法或描述,也不构成任何投资建议。对于访问者根据 FOLLOWME 社区提供的信息所做出的一切行为,除非另有明确的书面承诺文件,否则本社区不承担任何形式的责任。
FOLLOWME 交易社区网址: www.followme.asia


加载失败()