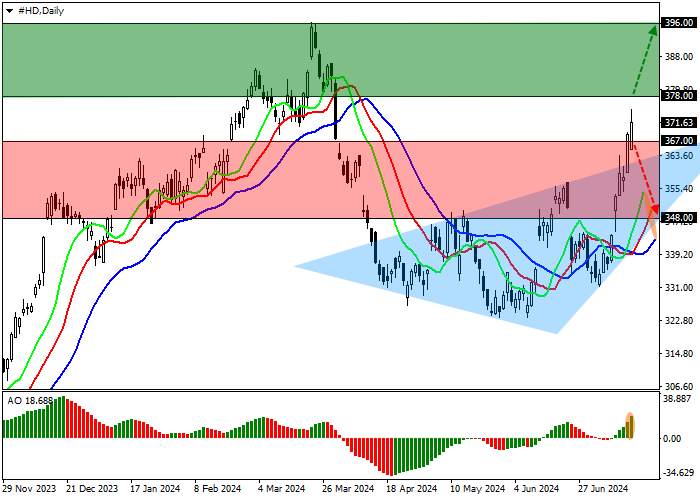
The shares of The Home Depot Inc., the largest home improvement company, are trading at 371.00.
On the daily chart, the price is correcting. Yesterday, it started the implementation of the reversal Head and shoulders pattern, having broken the Neckline at 360.00.
On the four-hour chart, the potential for continued growth remains high since the target for the pattern is the year’s high of 396.00. Consolidation of the asset below the high of June 24 at 360.00 will allow it to decline to 345.00 but the probability of it is low.
Technical indicators strengthen the buy signal: the EMA oscillation range on the Alligator indicator expands upwards, and the AO histogram forms ascending bars in the positive zone.
Trading tips
Long positions may be opened after the price rises and consolidates above 378.00, with the target at 396.00. Stop loss is around 370.00. Implementation period: 7 days or more.
Short positions may be opened after the price falls and consolidates below 367.00, with the target at 348.00. Stop loss is 375.00.


加载失败()