| Scenario | |
|---|---|
| Timeframe | Weekly |
| Recommendation | BUY STOP |
| Entry Point | 42.20 |
| Take Profit | 42.97, 43.75 |
| Stop Loss | 41.70 |
| Key Levels | 39.84, 40.62, 41.41, 42.19. 42.97, 43.75 |
| Alternative scenario | |
|---|---|
| Recommendation | SELL STOP |
| Entry Point | 41.40 |
| Take Profit | 40.62, 39.84 |
| Stop Loss | 42.00 |
| Key Levels | 39.84, 40.62, 41.41, 42.19. 42.97, 43.75 |
Current trend
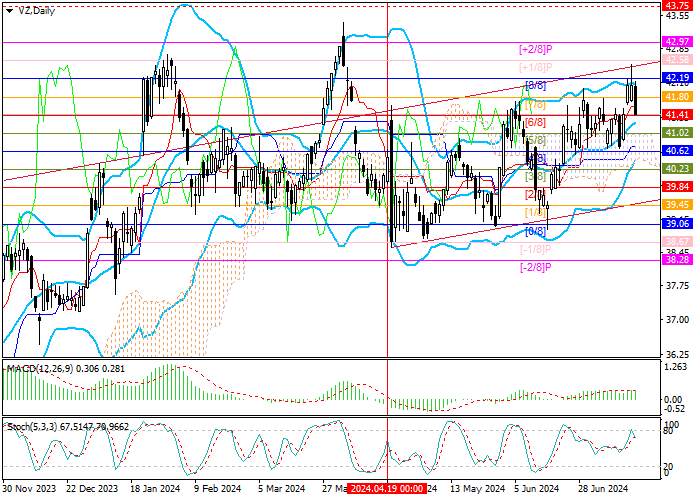
Shares of Verizon Communications Inc., one of the largest American telecommunications companies, have been forming an ascending channel for the fourth month. Last week, the quotes retested its upper limit but could not consolidate above it and corrected to the pivot level of 41.41 (Murrey level [6/8]), supported by the middle line of Bollinger Bands. After consolidation below, a decline to the area of 40.62 (Murrey level [4/8]) and 39.84 (Murrey level [2/8]) may follow. In case of a breakout of the upper border of the main Murrey trading range 42.19 (Murrey level [8/8]), an exit from the ascending channel and continuation of growth to the area of 42.97 (Murrey level [ 2/8]) and 43.75 (Murrey level [8/8], W1) are likely.
Technical indicators do not give a single signal: Bollinger bands are directed upwards, and the MACD histogram is stable in the positive zone, confirming the upward trend in the market. Stochastic is reversing downwards from the overbought zone, allowing a downward correction.
Support and resistance
Resistance levels: 42.19. 42.97, 43.75.
Support levels: 41.41, 40.62, 39.84.

Trading tips
Long positions may be opened above 42.19, with the targets at 42.97, 43.75, and stop loss 41.70. Implementation period: 5–7 days.
Short positions may be opened below 41.41, with the targets at 40.62, 39.84, and stop loss 42.00.
风险提示:以上内容仅代表作者或嘉宾的观点,不代表 FOLLOWME 的任何观点及立场,且不代表 FOLLOWME 同意其说法或描述,也不构成任何投资建议。对于访问者根据 FOLLOWME 社区提供的信息所做出的一切行为,除非另有明确的书面承诺文件,否则本社区不承担任何形式的责任。
FOLLOWME 交易社区网址: www.followme.asia


加载失败()