| Scenario | |
|---|---|
| Timeframe | Intraday |
| Recommendation | BUY STOP |
| Entry Point | 0.8600 |
| Take Profit | 0.8700 |
| Stop Loss | 0.8553 |
| Key Levels | 0.8400, 0.8450, 0.8500, 0.8553, 0.8600, 0.8630, 0.8665, 0.8700 |
| Alternative scenario | |
|---|---|
| Recommendation | SELL STOP |
| Entry Point | 0.8550 |
| Take Profit | 0.8450 |
| Stop Loss | 0.8600 |
| Key Levels | 0.8400, 0.8450, 0.8500, 0.8553, 0.8600, 0.8630, 0.8665, 0.8700 |
Current trend
During the Asian session, the USD/CHF pair is correcting upwards, testing 0.8570, while the franc received support amid falling stock markets, concerns about the growth of the US economy, and the escalation of the military conflict in the Middle East.
The American dollar fell after the publication of the labor market report on Friday. The unemployment rate adjusted from 4.1% to 4.3% and nonfarm payrolls – from 179.0K to 114.0K, increasing the likelihood of a hard landing of the economy. Investors believe that the US Fed is delaying its monetary policy change, as it did during the COVID–19 epidemic, and the likelihood of a September rate cut has increased, with some experts believing that the change in the indicator will be 50 basis points. In July, the ISM service PMI increased from 48.8 points to 51.4 points, better than the expectation of 51.0 points, while the S&P Global index fell from 56.0 points to 55.0 points, contrary to neutral forecasts.
On Tuesday, August 6, the franc was under pressure due to July labor market statistics. The seasonally adjusted unemployment rate rose from 2.4% to 2.5% and without it, it consolidated at 2.3%, which may affect the Swiss National Bank’s monetary policy.
Support and resistance
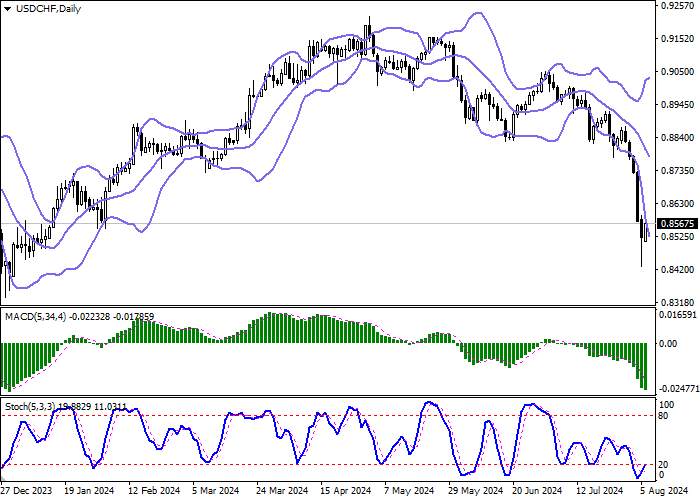
On the daily chart, Bollinger bands are steadily declining. The price range is expanding from below but not as fast as the “bearish” sentiment develops. The MACD indicator maintains a strong sell signal, located below the signal line, and Stochastic, having retreated from the lows, is reversing into an ascending plane, signaling for corrective growth soon.
Resistance levels: 0.8600, 0.8630, 0.8665, 0.8700.
Support levels: 0.8553, 0.8500, 0.8450, 0.8400.


Trading tips
Long positions may be opened after a breakout of 0.8600, with the target at 0.8700. Stop loss — 0.8553. Implementation period: 2–3 days.
Short positions may be opened after a rebound from the 0.8600 level and a breakdown of 0.8553, with the target at 0.8450. Stop loss is 0.8600.
风险提示:以上内容仅代表作者或嘉宾的观点,不代表 FOLLOWME 的任何观点及立场,且不代表 FOLLOWME 同意其说法或描述,也不构成任何投资建议。对于访问者根据 FOLLOWME 社区提供的信息所做出的一切行为,除非另有明确的书面承诺文件,否则本社区不承担任何形式的责任。
FOLLOWME 交易社区网址: www.followme.asia


加载失败()