Current trend
The shares of the American holding Alphabet Inc. are in a local downtrend and are trading at around 160.00.
Yesterday, it became known that the design flaws identified during recent testing in the artificial intelligence chips from Nvidia Corp. may cause delays in deliveries. According to preliminary data, the contracts will be postponed for three or more months. Alphabet Inc. has ordered chips of the latest Blackwell series worth more than 10.0 billion dollars, and delays are already negatively affecting quotes. Additional pressure on the opinion of investors was exerted by the recent sale by the investment company Berkshire Hathaway of more than half of its share in the production of the iPhone.
According to the financial report for the second quarter, Alphabet Inc. managed to record revenue of 84.74 billion dollars, significantly higher than the figure of 74.69 billion dollars for the same period in 2023. Earnings per share (EPS) amounted to 1.89 dollars, also above the last year's value of 1.44 dollars.
On September 19, quarterly dividends of 0.2 dollars per paper will be sent to shareholders, which is equivalent to a yield of 0.48% per annum. This will happen for the second time after the test payout on June 17, increasing the likelihood that dividends will become a permanent practice in the company.
Support and resistance
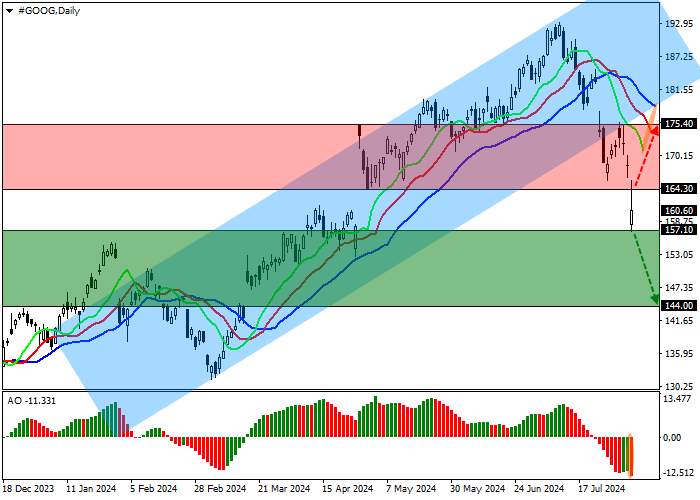
A corrective decline continues on the D1 chart, which develops as part of working out the exit from the ascending channel with the boundaries of 200.00–175.00.
Technical indicators hold a stable sell signal: the range of fluctuations of the EMAs of the Alligator indicator is expanding in the direction of decline, and the histogram of AO is trading in the negative zone, forming new descending bars.
Support levels: 157.10, 144.00.
Resistance levels: 164.30, 175.40.
Trading tips
In case of a reversal and continued decline of the asset, as well as price consolidation below the support level of 157.10, one can open short positions with the target of 144.00 and stop-loss of 164.00. Implementation period: 7 days and more.
If the asset continues to grow and the price consolidates above the resistance level of 164.30, one may open long positions with the target of 175.40 and stop-loss of 160.00.


Tải thất bại ()