Current trend
Shares of The Boeing Co., one of the largest manufacturers of aviation and space technology, are adjusting around 168.00.
Management reported that 43 commercial aircraft were delivered in July, which coincides with the figure for the same period a year earlier, and noted that by the end of the year, it is planned to increase the volume of deliveries, as the assembly line has started working at full capacity after eliminating delays due to the recent incident with the Boeing 737 MAX 9 aircraft, which had the cabin depressurized during the flight. At the same time, 72 new orders were received in July (57 of which were at the recently completed Farnborough Airshow), more than 52 applications over the same period in 2023. In addition, the case of criminal conspiracy for fraudulent purposes against The Boeing Co. by the U.S. Department of Justice was completed, and the company agreed to pay compensation in the amount of 243.6 billion dollars.
Despite the ongoing problems, analysts at Stifel Financial Corp. maintained the rating of the emitter's shares at the "buy" level with a target price of 235.0 dollars per paper. Experts made this decision against the background of signs of an increase in deliveries of Boeing 737 MAX: in July, 31 aircrafts of this model were sent to customers out of a total of 43 commercial airliners, which is much more than the eleven Boeing 737 MAX delivered in June. Analysts consider this confirmation that the company will be able to show growth by the end of the year.
Support and resistance
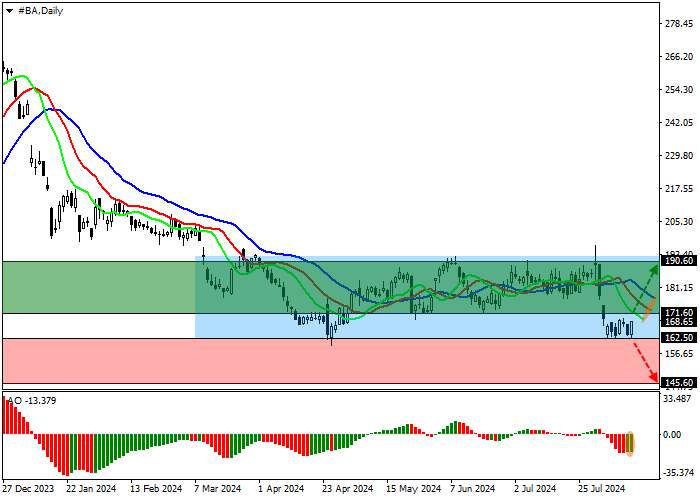
On the D1 chart, the asset is trading in a side channel with the boundaries of 191.00–162.50, but cannot overcome its support line.
Technical indicators hold the sell signal, which has begun to slow down: the range of EMAs fluctuations on the Alligator indicator remains quite wide, and the AO histogram forms new ascending bars.
Support levels: 162.50, 145.60.
Resistance levels: 171.60, 190.60.
Trading tips
If the asset continues to grow and the price consolidates above the maximum of 171.60, one may open long positions with the target of 190.60 and stop-loss of 167.00. Implementation period: 7 days and more.
If the asset continues to decline and the price consolidates below the minimum of 162.50, short positions with the target of 145.60 and stop-loss of 170.00 will be relevant.


Tải thất bại ()