| Scenario | |
|---|---|
| Timeframe | Weekly |
| Recommendation | SELL STOP |
| Entry Point | 2470.00 |
| Take Profit | 2120.00, 1875.00 |
| Stop Loss | 2700.00 |
| Key Levels | 1875.00, 2120.00, 2500.00, 2700.00, 2812.50, 3125.00, 3437.50 |
| Alternative scenario | |
|---|---|
| Recommendation | BUY STOP |
| Entry Point | 2840.00 |
| Take Profit | 3125.00, 3437.50 |
| Stop Loss | 2590.00 |
| Key Levels | 1875.00, 2120.00, 2500.00, 2700.00, 2812.50, 3125.00, 3437.50 |
Current trend
The ETH/USD pair has been trading in the main sideways range of 2700.00–2500.00 for over a week.
Experts believe that investors are in no hurry to open new positions, as they have adopted a wait-and-see attitude until the publication of the results of the September meeting of the US Fed, at which monetary parameters may be changed again. On Friday, the head of the regulator, Jerome Powell, will speak at the annual Economic Symposium in Jackson Hole, where he may voice the authorities’ position on the timing and volume of interest rate cuts. Now, scenarios with an adjustment of –25 basis points or –50 basis points are being considered. Also, the easing of monetary policy will be carried out against a strong American economy, which will provide additional support to the American dollar, preventing cryptocurrency from continuing its confident upward dynamics.
As for the ETH token, it has recently been experiencing additional pressure. Since the launch of new Ethereum-based exchange-traded funds in July, the price has fallen by more than 26.0%, and the total net outflow of investments from Ethereum-ETFs amounted to more than 420.0M dollars (last week alone, investors withdrew 14.1M dollars).
In these conditions, the resumption of the downward dynamics of the ETH/USD pair is the most likely scenario.
Support and resistance
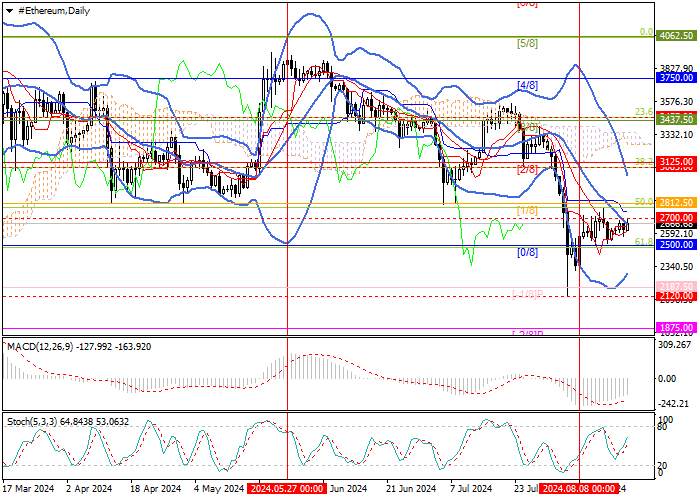
Technically, the price remains at the upper border of the sideways range of 2700.00–2500.00, supported by the middle line of Bollinger bands. After a breakout of 2812.50 (Murrey level [1/8], Fibonacci correction 50.0%), growth may reach 3125.00 (Murrey level [2/8]) and 3437.50 (Murrey level [3/8], Fibonacci correction 23.6%). A consolidation below the “bearish” level is 2500.00 (Murrey level [0/8], Fibonacci correction 61.8%), consolidation below which will increase the probability of testing the 2120.00 (August lows) and 1875.00 (Murrey level [–2/8]) marks.
Technical indicators do not give a single signal: Bollinger bands are directed downwards, and Stochastic is upwards, while the MACD histogram is stable in the negative zone, which confirms the continuation of the medium-term downward trend in the market.
Resistance levels: 2700.00, 2812.50, 3125.00, 3437.50.
Support levels: 2500.00, 2120.00, 1875.00.

Trading tips
Short positions may be opened below 2500.00, with the targets at 2120.00, 1875.00 and stop loss 2700.00. Implementation period: 5–7 days.
Long positions may be opened above 2812.50, with the targets at 3125.00, 3437.50, and stop loss 2590.00.
风险提示:以上内容仅代表作者或嘉宾的观点,不代表 FOLLOWME 的任何观点及立场,且不代表 FOLLOWME 同意其说法或描述,也不构成任何投资建议。对于访问者根据 FOLLOWME 社区提供的信息所做出的一切行为,除非另有明确的书面承诺文件,否则本社区不承担任何形式的责任。
FOLLOWME 交易社区网址: www.followme.asia


加载失败()