The bearish engulfing candle is one of the most straightforward price action signals in the forex market. Many traders rely on this candlestick pattern to identify potential price reversals and continuations, integrating it into their trading strategies.
This article will cover:
- What is the bearish engulfing candle?
- How to identify and interpret the bearish engulfing candle in forex trading
- How to trade forex using the bearish engulfing pattern
What is a Bearish Engulfing Pattern?
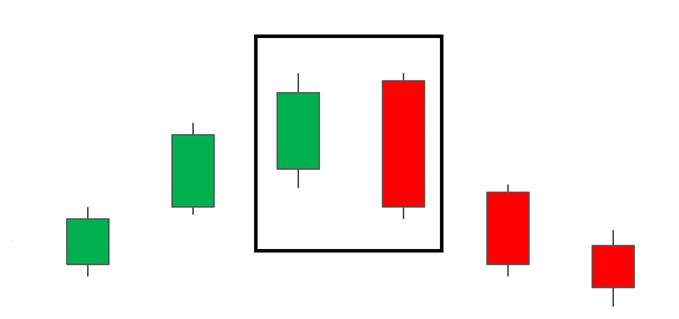
A bearish engulfing pattern provides the strongest signal when it appears at the end of an uptrend. This pattern is formed by interpreting the data from two consecutive candles:
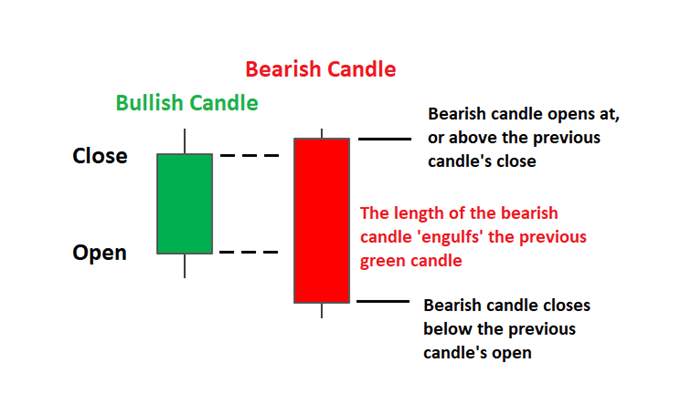
• First Candle: The first candle represents the end of the established trend’s strength. While the size of this initial bullish candle can vary, it’s essential that the body of this candle is completely engulfed by the following candle. Dojis and other small bullish candles offer the strongest signals, as they often indicate market indecision within the current trend.
• Second Candle: The second candle serves as the reversal signal. This candle is a long red (bearish) candle, creating fresh downward price momentum. It should open above the close of the previous candle and close well below the low of the previous candle. This strong downward movement reflects sellers overtaking the buying strength, often leading to a continued decline in price. The further this second bearish candle drops, the stronger the signal becomes.
Know the Difference Between a Bearish Engulfing Pattern and a Bullish Engulfing Pattern
Engulfing patterns can be either bullish or bearish. The bullish engulfing pattern is essentially the opposite of the bearish engulfing pattern discussed above. Instead of appearing in an uptrend, it occurs at the bottom of a downtrend and signals traders to go long. This pattern is characterized by a red candle being completely engulfed by a larger green candle.
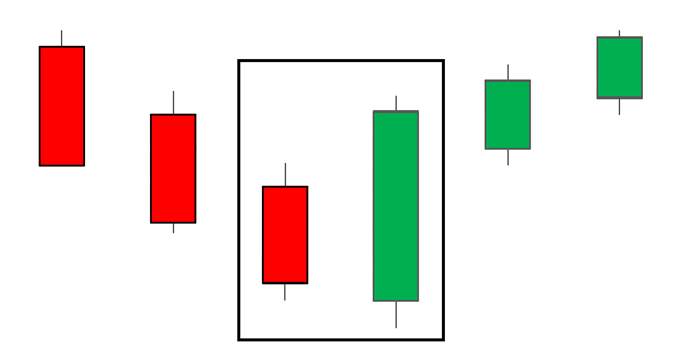
• Location: Appears at the bottom of a downtrend.
• Signal: Indicates a bullish reversal, suggesting it’s time to buy or go long.
Below is a summary of the main differences between the bullish and bearish engulfing patterns. Traders should keep these distinctions in mind to avoid false signals.
| Engulfing Pattern | Characteristics | Location | Signal |
|---|---|---|---|
| Bullish Engulfing | Green candle engulfs previous (smaller) red candle | Appears at the bottom of a downtrend | Bullish signal (Bullish reversal) |
| Bearish Engulfing | Red candle engulfs previous (smaller) green candle | Appears at the top of an uptrend | Bearish signal (Bearish reversal) |
Using a Bearish Engulfing Candle in Trading
Traders should always seek confirmation for a trade by utilizing indicators, key levels of support and resistance, or other techniques that can either validate or invalidate a trade. Below are two approaches traders can use to strengthen the bearish bias suggested by the bearish engulfing pattern.
Trading the Bearish Engulfing Candle Using Indicators
The example below highlights a bearish engulfing pattern appearing at the top of an uptrend on the EUR/USD daily chart. While trading against the trend is generally not advisable, reversals do occur, making it important for traders to recognize when this is likely to happen.
In this chart, the Euro is shown appreciating and topping out where the bearish engulfing pattern appears. Additionally, the Relative Strength Indicator (RSI), circled in black, supports the bearish bias by providing an ‘overbought’ signal.
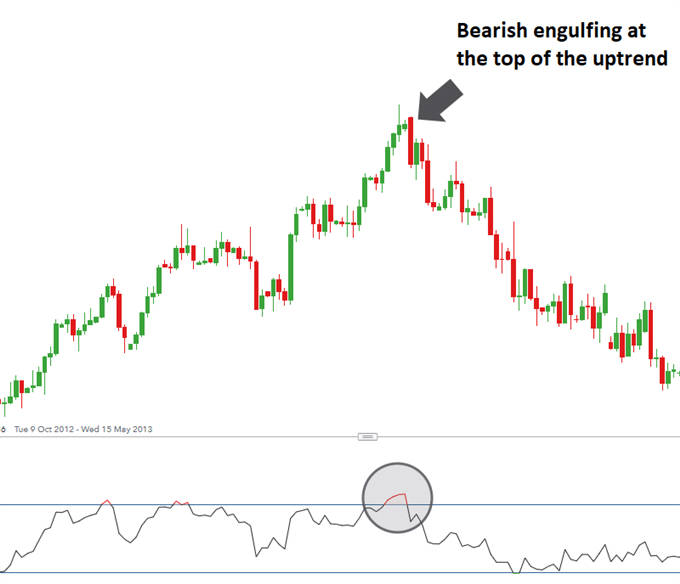
EUR/USD Bearish Engulfing Supported by an Overbought Signal in the RSI
Taking a closer look at the chart, entry levels, stop-loss placements, and targets can be identified.
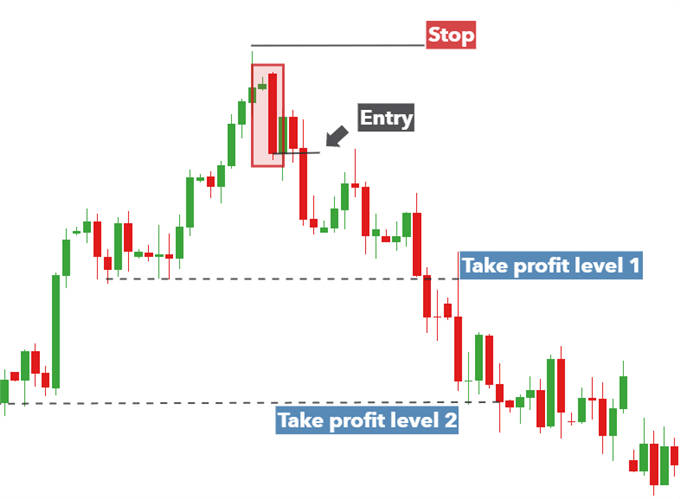
Trading the Bearish Engulfing Candle Pattern in EUR/USD
• Entry: Traders can wait for a close below the low of the bearish candle or place pending orders just below this level.
• Stop Loss: A stop-loss can be placed above the recent swing high, as a move above this level would invalidate the trade and provides a sensible risk-to-reward ratio.
• Target/Take Profit: Since bearish engulfing candles can signal the beginning of a prolonged downtrend, consider setting an initial take-profit level while remaining open to further downward movement. Stops can be adjusted accordingly, or a trailing stop can be used.
Trading the Bearish Engulfing Candle Using Support & Resistance
The chart below shows a bearish engulfing candle pattern appearing at a resistance level on the US Dollar Index (DXY). The significance of this resistance level lies in the fact that previous upward movements were rejected at this point. When a bearish engulfing pattern appears at resistance, it provides greater confidence in a bearish bias.
Bearish Engulfing Pattern Validated by Resistance Level
• Entry: Given that the bearish engulfing pattern is reinforced by the resistance level, traders may consider entering the trade at the open of the following candle.
• Stop Loss: The stop can be placed above the bearish engulfing candle and the resistance level. A move above this level would invalidate the trade.
• Target/Take Profit: Targets can be set at a recent support level. As with the previous example, traders may consider a second target level or implement a trailing stop, as the bearish engulfing candle could signal the start of a sustained downtrend.


Tải thất bại ()