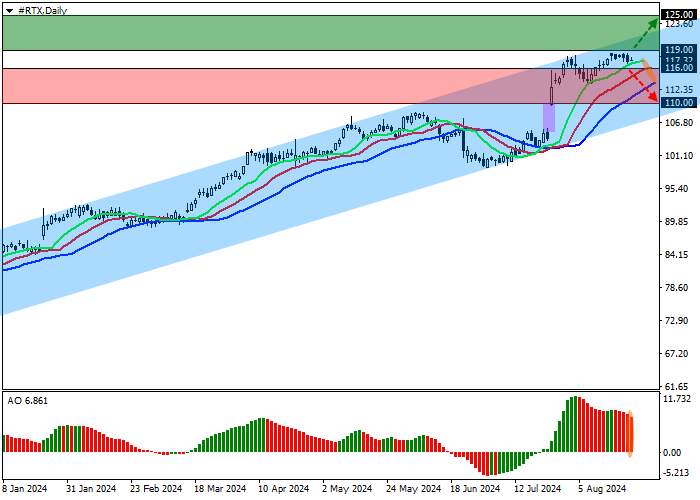
The shares of RTX Corp., an American aerospace and defense conglomerate, are correcting at 117.00.
On the daily chart, the price is holding just below the resistance line of the 123.00–107.00 channel.
On the four-hour chart, it is clear that the upward movement itself has long since developed into an independent trend, confirmed by the recent price gap between 110.00 and 105.00. This gap was not worked out, indicating the strength of the trend, the goal of which may be to exit the channel with consolidation above 119.00.
Technical indicators are holding the buy signal, maintaining it against a local correction: the fast EMA on the Alligator indicator are above the signal line, and the histogram of the AO oscillator is forming new correction bars in the buy zone.
Trading tips
Long positions may be opened after the price consolidates above the resistance level of 119.00, with the target at 125.00. Stop loss — 116.00. Implementation period is 7 days or more.
Short positions may be opened after the price consolidates below the low of 116.00, with the target at 110.00. Stop loss — 119.00.


Tải thất bại ()