| Scenario | |
|---|---|
| Timeframe | Weekly |
| Recommendation | BUY STOP |
| Entry Point | 351. 60 |
| Take Profit | 359.38, 367.19, 375.00 |
| Stop Loss | 345.30 |
| Key Levels | 312.50, 335.94, 351.56, 359.38, 367.19, 375.00 |
| Alternative scenario | |
|---|---|
| Recommendation | SELL STOP |
| Entry Point | 335.90 |
| Take Profit | 320.31, 312.50 |
| Stop Loss | 341.00 |
| Key Levels | 312.50, 335.94, 351.56, 359.38, 367.19, 375.00 |
Current trend
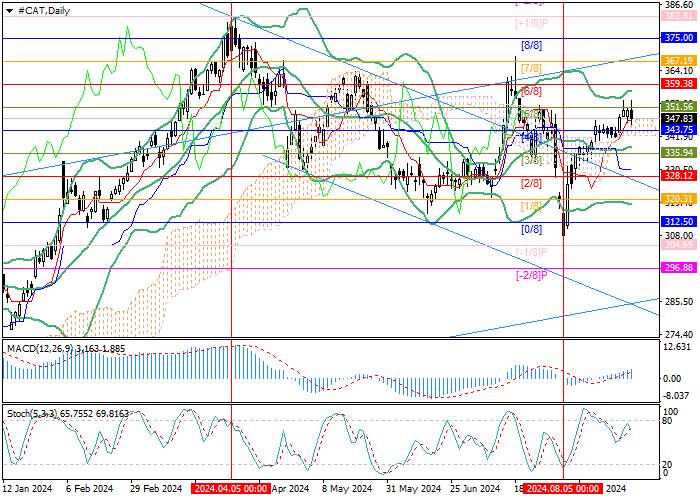
Shares of Caterpillar Inc., a manufacturer of construction and mining equipment, have been actively increasing in value since the beginning of the month amid strong financial statements and investor hopes for a quick transition to a “dovish” course of the US Fed. Now, the quotes are testing the level of 351.56.
Thus, the corporation’s revenue amounted to 16.69B dollars, higher than expectations by 20.0M dollars, and earnings per share reached 5.99 dollars, 0.45 dollars more than average estimates. Over the past four quarters, the indicator exceeded expert forecasts three times, and revenue – only once. Statistics confirm the stable position of the company, and experts believe that in the next six months, it may improve due to the beginning of the reduction of interest rates by the US Fed, expected in September. The policy should lead to the recovery of the national economy, in particular, the construction market, which will have a positive effect on sales volume.
Support and resistance
The trading instrument has left the medium-term downward channel. It istesting 351.56 (Murrey level [5/8]), consolidation above which will allow it to reach the area of 359.38 (Murrey level [6/8]), 367.19 (Murrey level [7/8]), and 375.00 (Murrey level [8/8]). In case of consolidation below 335.94 (Murrey level [3/8]), supported by the middle line of Bollinger bands, a decline to the targets of 320.31 (Murrey level [1/8]) and 312.50 (Murrey level [0/8]) may follow.
Technical indicators do not give a single signal: Bollinger Bands are horizontal, MACD histogram is increasing in the positive zone, and Stochastic is reversing downwards.
Resistance levels: 351.56, 359.38, 367.19, 375.00.
Support levels: 335.94, 320.31, 312.50.

Trading tips
Long positions may be opened above 351.56, with the targets 359.38, 367.19, 375.00, and stop loss 345.30. Implementation period: 5–7 days.
Short positions may be opened below 335.94, with the targets 320.31, 312.50, and stop loss 341.00.
风险提示:以上内容仅代表作者或嘉宾的观点,不代表 FOLLOWME 的任何观点及立场,且不代表 FOLLOWME 同意其说法或描述,也不构成任何投资建议。对于访问者根据 FOLLOWME 社区提供的信息所做出的一切行为,除非另有明确的书面承诺文件,否则本社区不承担任何形式的责任。
FOLLOWME 交易社区网址: www.followme.asia


加载失败()