General Electric Co., an American diversified corporation, is trading at 174.00.
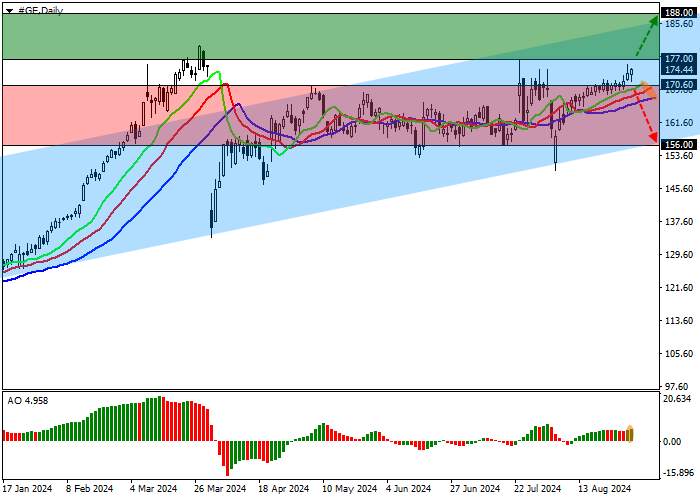
On the daily chart, the price maintains stable dynamics in the correction trend, forming an ascending channel with dynamic boundaries of 187.00–156.00.
On the four-hour chart, the quotes are moving towards the resistance line of 185.00. Today, they can consolidate above the previous trend high of 177.00. After a breakdown of 170.00, the probability of a downward movement will increase.
Technical indicators reinforce the buy signal: fast EMA on the Alligator indicator crossed the signal line upwards, expanding the range of fluctuations, and the AO histogram forms correction bars above the transition level.
Trading tips
Long positions may be opened after the price rises and consolidates above 177.00, with the target at 188.00. Stop loss is 175.00. Implementation period: 7 days or more.
Short positions may be opened after the price falls and consolidates below 170.60, with the target at 156.00. Stop loss is 173.00.


加载失败()