Current trend
The shares of RTX Corp., an American aerospace and defense conglomerate, are moving within a long-term upward trend but yesterday, they corrected to the 120.80 region.
Experts believe that the negative dynamics are due to the fall in the quotations of Nvidia Corp. shares. Yesterday, the world leader in semiconductor production received a subpoena from the US Department of Justice as part of an antitrust investigation, which put pressure not only on its shares but also on the industries using its products. However, the decline looks temporary since long-term fundamental factors remain positive. Thus, against global geopolitical instability, accompanied by the Middle East and Ukrainian armed conflicts, the governments of the world’s leading powers are increasing defense budgets, which increases demand for RTX Corp. products. In particular, the corporation recently signed a million-dollar contract with the US Department of Defense to develop advanced sensors for the F–22 aircraft. Also, in the medium term, the stock market should receive support from the September start of easing the monetary policy of the US Fed.
Financial forecasts for the current year suggest revenue of 78.75–79.50B dollars, higher than the analyst consensus forecast of 72.8B dollars, and adjusted earnings per share may amount to 5.35–5.45 dollars, compared to expectations of 4.95 dollars per share.
Support and resistance
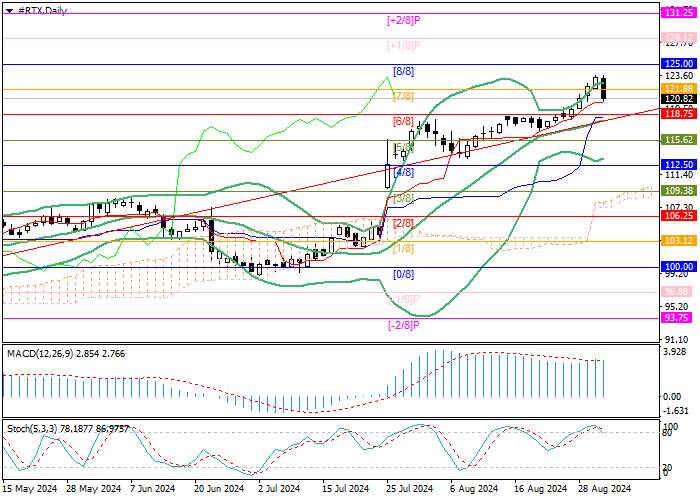
Technical indicators reflect the continuation of the upward trend. Bollinger bands are reversing upwards, and the MACD histogram is stabilizing in the positive zone. A downward reversal of Stochastic in the overbought zone does not exclude a correction to the 118.75 area (Murrey level [6/8], the middle line of Bollinger bands) but is unlikely to lead to a change in trend. If the price consolidates back above 121.88 (Murrey level [7/8]), the growth of the quotes will resume to the area of 125.00 (Murrey level [8/8]), 128.12 (Murrey level [ 1/8]) and 131.25 (Murrey level [ 2/8]).
Resistance levels: 121.88, 125.00, 128.12, 131.25.
Support levels: 118.75, 115.62, 112.50.

Trading tips
Long positions may be opened above 121.88 or at a reversal around 118.75, with the targets of 125.00, 128.12, 131.25, and stop losses 119.75 and 116.30 respectively. Implementation period: 5–7 days.


Tải thất bại ()