| Scenario | |
|---|---|
| Timeframe | Weekly |
| Recommendation | BUY STOP |
| Entry Point | 7560.0 |
| Take Profit | 7750.0 |
| Stop Loss | 7500.0 |
| Key Levels | 7240.0, 7430.0, 7560.0, 7750.0 |
| Alternative scenario | |
|---|---|
| Recommendation | SELL STOP |
| Entry Point | 7430.0 |
| Take Profit | 7240.0 |
| Stop Loss | 7500.0 |
| Key Levels | 7240.0, 7430.0, 7560.0, 7750.0 |
Current trend
One of the leading indices of the European economy CAC 40 is correcting at 7490.0, supported by macroeconomic statistics. Yesterday, data on business activity was published: the Services PMI in August corrected to 55.0 points from 50.1 points, reaching a maximum since April last year, and the Composite PMI – to 53.1 points from 49.1 points. Experts note that the industry is recovering after the Olympic and Paralympic Games in Paris but fear a resumption of the decline after their completion, since domestic demand remains weak overall. The July producer price index (PPI) increased from 0.6% to 0.8% MoM instead of the expected 0.3% and from ˗3.3% to ˗2.1% YoY, but overall inflation in the Eurozone is slowing, which increases the likelihood of monetary policy easing by officials of the European Central Bank (ECB).
At the beginning of the week, auctions were held to place short-term French bills: the rate on three-month bonds increased to 3.462% from 3.372%, and on six-month bonds to 3.308% from 3.285%. The bond market continues to adjust, putting slight pressure on CAC 40 quotes: the yield on 10-year debt securities slightly decreased to 2.932% from 2.940%, and on 20-year bonds to 3.279% from 3.285%.
The growth leaders in the index are Sanofi SA ( 1.48%), Eurofins Scientific SE ( 1.22%), Danone SA ( 1.07%).
Among the leaders of the decline are LVMH Moet Hennessy Louis Vuitton SE (˗4.22%), Hermes International SCA (˗3.84%), Kering SA (˗2.22%), Pernod Ricard SA (˗2.00%).
Support and resistance
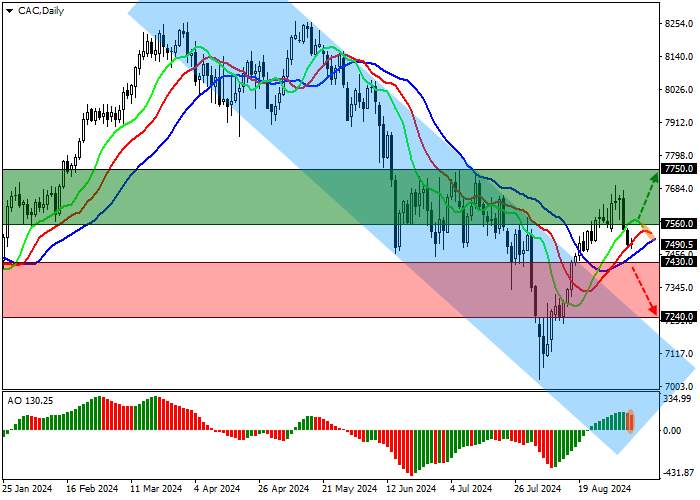
On the D1 chart, quotes continue a local correction, again approaching the resistance line of the descending channel with boundaries of 7450.0–7000.0.
Technical indicators maintain a stable buy signal: fast EMAs on the Alligator indicator are above the signal line, maintaining a confident range of fluctuations, and the AO histogram, remaining close to the transition level, forms correction bars.
Support levels: 7430.0, 7240.0.
Resistance levels: 7560.0, 7750.0.

Trading tips
In case of a reversal and continued growth of the asset, as well as consolidation of the price above the resistance level of 7560.0, buy positions with a target of 7750.0 and a stop-loss of 7500.0 will be relevant. Implementation period: 7 days and more.
In case of a reversal and continued decline of the asset, as well as consolidation of the price below the support level of 7430.0, sell positions with a target of 7240.0 can be opened. Stop loss – 7500.0.
风险提示:以上内容仅代表作者或嘉宾的观点,不代表 FOLLOWME 的任何观点及立场,且不代表 FOLLOWME 同意其说法或描述,也不构成任何投资建议。对于访问者根据 FOLLOWME 社区提供的信息所做出的一切行为,除非另有明确的书面承诺文件,否则本社区不承担任何形式的责任。
FOLLOWME 交易社区网址: www.followme.asia


加载失败()