PayPal Holdings Inc., H4
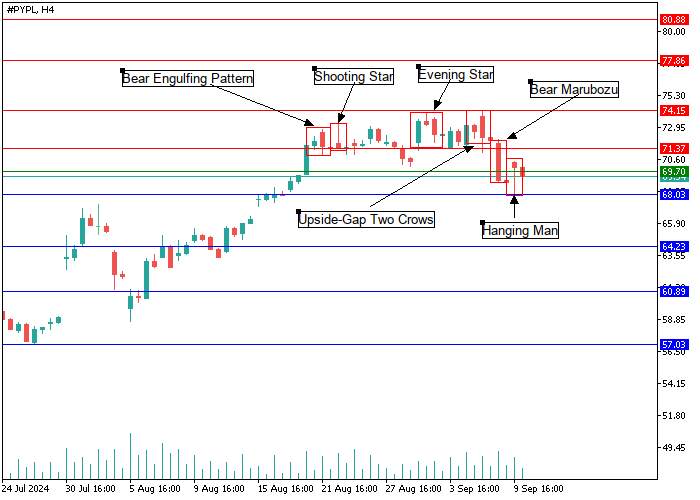
On the H4 chart of shares of PayPal Holdings Inc., an American debit payment system, there is a formation of a series of reversal patterns of candle analysis "Bear Engulfing Pattern", "Shooting Star", "Evening Star", "Bear Marubozu", "Upside-Gap Two Crows" and "Hanging Man" in the price range 74.15-69.70, which signal about the strong pressure on the price from sellers. Overcoming the key resistance level of 68.03 may provoke a further decline in the quotes of the trading instrument to the area of 64.23–57.03. If "bullish" patterns form on the chart, and the price can overcome the resistance level of 71.37 on increased trading volumes, one should expect a continuation of positive dynamics to the area of 74.15–80.88.

PayPal Holdings Inc., D1
On the D1 chart, asset quotes move within the short–term uptrend, forming in the area of 74.15-68.03 the candle patterns "Dark-Cloud Cover", "Bear Marubozu", "Shooting Star" and "Hanging Man", which signal a "bearish" reversal and warn market participants about reaching the high price area. In the current situation, a more likely scenario is a decrease in the value of the asset to the key support level of 68.03, overcoming which will become a catalyst for opening short positions with targets in the area of 64.23–57.03.

Support and resistance
Support levels: 68.03, 64.23, 60.89, 57.03.
Resistance levels: 71.37, 74.15, 77.86, 80.88.
Trading tips
Short positions can be opened below the 68.03 mark with targets 64.23, 60.89, 57.03. Stop-loss – 69.70. Implementation time: 9–12 days.
Long positions can be opened above 71.37 with targets of 74.15, 77.86, 80.88. Stop-loss – 69.70.


Để lại tin nhắn của bạn ngay bây giờ