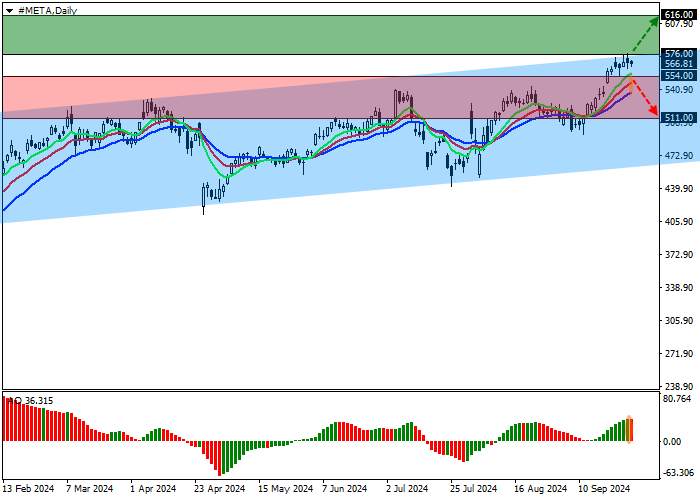
Shares of Meta Platforms Inc., an American multinational holding company owning a technology conglomerate and the largest Facebook social network, are trading at 567.00.
A correction trend is forming on the daily chart, within which the price is held in a wide ascending channel with dynamic boundaries of 576.00–470.00.
On the four-hour chart, the quotes reached the resistance line of 476.00. Despite the slowdown, a consolidation above the year’s high of 543.00 may follow.
Technical indicators maintain a buy signal: fast EMAs on the Alligator indicator are moving away from the signal line, and the AO histogram is forming correction bars in the buy zone.
Trading tips
Long positions may be opened after the price grows and consolidates above 576.00, with the target at 616.00. Stop loss — 568.00. Implementation period: 7 days or more.
Short positions may be opened after the price declines and consolidates below 554.00, with the target at 511.00. Stop loss — 565.00.
Tuyên bố miễn trừ trách nhiệm: Quan điểm được trình bày hoàn toàn là của tác giả và không đại diện cho quan điểm chính thức của Followme. Followme không chịu trách nhiệm về tính chính xác, đầy đủ hoặc độ tin cậy của thông tin được cung cấp và không chịu trách nhiệm cho bất kỳ hành động nào được thực hiện dựa trên nội dung, trừ khi được nêu rõ bằng văn bản.


Tải thất bại ()