Current trend
The NZD/USD pair is showing moderate growth, correcting after a significant weakening last week, which resulted in a renewal of the local lows of September 12. The instrument is testing 0.6160 for a breakout, while the macroeconomic background remains quite calm.
In anticipation of new drivers of movement, investors are assessing Friday's labor market statistics, which provided additional support to the US dollar and further reduced the likelihood of an interest rate adjustment by –50 basis points by the end of this year. Nonfarm Payrolls in September increased from 159.0 thousand to 254.0 thousand, significantly exceeding the forecast of 140.0 thousand. It is also worth noting that the previous month's figure was revised up from 142.0 thousand to 159.0 thousand, while Average Hourly Earnings accelerated from 3.9% to 4.0% year-on-year, but slowed down slightly from 0.5% to 0.4% month-on-month, and the Unemployment Rate fell from 4.2% to 4.1%.
Analysts expect the Reserve Bank of New Zealand (RBNZ) to cut borrowing costs by 50 basis points to 4.75% at its meeting on October 9. Officials received no new information on inflation, but the Consumer Price Index fell more than expected in July to 3.3%, while the Core CPI was above expectations at 5.4%, but the loss of economic momentum is still adding to pressure on the central bank to push borrowing costs rapidly towards the 3.00% target, according to analysts at ING Research. The RBNZ's latest forecasts are for the CPI to come in at 2.3% and the Core CPI at 5.1% in the third quarter.
Support and resistance
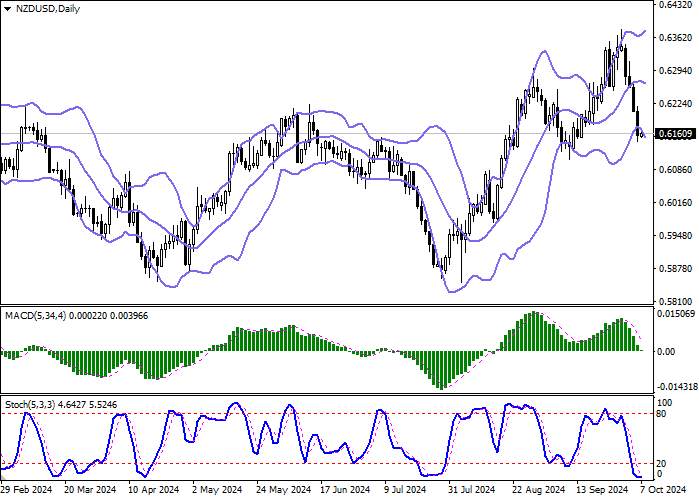
On the daily chart, Bollinger Bands are trying to reverse into the descending plane. The price range is expanding; however, it fails to catch the surge of the "bearish" sentiment at the moment. MACD is going down preserving a stable sell signal (located below the signal line). The indicator is trying to consolidate below the zero level. Stochastic, having reached the zero level, reversed into the horizontal plane, indicating significant risks of the oversold instrument in the ultra-short term.
Resistance levels: 0.6177, 0.6200, 0.6221, 0.6254.
Support levels: 0.6145, 0.6124, 0.6100, 0.6085.


Trading tips
Short positions may be opened after a breakdown of 0.6145 with the target at 0.6100. Stop-loss — 0.6170. Implementation time: 2-3 days.
The appearance of the "bullish" trend with the breakout of 0.6177 may become a signal for new purchases with the target of 0.6221. Stop-loss — 0.6155.


Tải thất bại ()