| Scenario | |
|---|---|
| Timeframe | Weekly |
| Recommendation | SELL STOP |
| Entry Point | 0.6050 |
| Take Profit | 0.5986, 0.5908 |
| Stop Loss | 0.6100 |
| Key Levels | 0.5908, 0.5986, 0.6055, 0.6109, 0.6163, 0.6252 |
| Alternative scenario | |
|---|---|
| Recommendation | BUY STOP |
| Entry Point | 0.6110 |
| Take Profit | 0.6163, 0.6252 |
| Stop Loss | 0.6060 |
| Key Levels | 0.5908, 0.5986, 0.6055, 0.6109, 0.6163, 0.6252 |
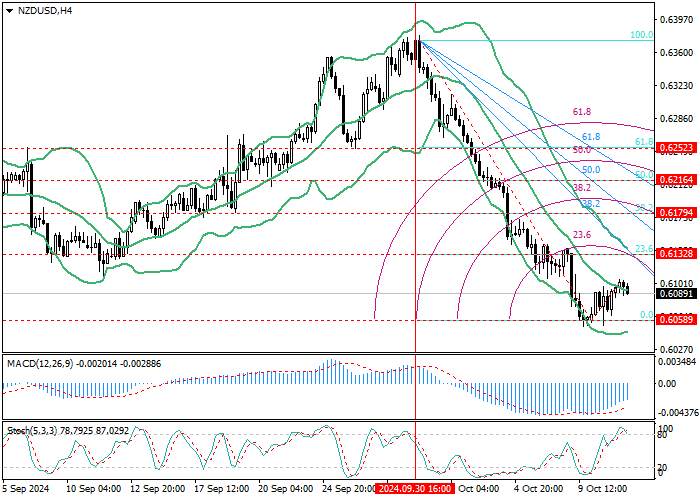
NZD/USD, H4
On the H4 chart, the NZD/USD pair is trying to start a corrective growth, reversing at 0.6058 (0.0% retracement, near three-month lows). If the price consolidates above the central line of Bollinger Bands, the upward dynamics will be able to strengthen towards the targets of 0.6179 (38.2% retracement) and 0.6252 (61.8% retracement). With a reverse breakdown down of the level of 0.6058, the decline will resume to the area of 0.5908 (61.8% Fibonacci extension).
Technical indicators allow for continued decline: Bollinger Bands are pointing downwards, Stochastic is preparing to leave the overbought zone and form a sell signal, MACD is growing, but remains in the negative zone.

NZD/USD, D1
On the D1 chart, the price reached 0.6055 (61.8% retracement), but cannot break below it yet. If successful, the targets for further decline will be 0.5986 (the area of intersection with the oncoming ascending fan) and 0.5875 (100.0% retracement). With a breakout of 0.6109 (50.0% retracement), the movement will continue to the targets of 0.6163 (38.2% retracement) and 0.6233 (23.6% retracement, the central line of Bollinger Bands).
Technical indicators do not give a clear signal: Bollinger Bands are reversing down, MACD has moved into a negative zone, confirming the formation of a downtrend, but Stochastic is preparing to leave the oversold zone, which does not exclude the possibility of corrective growth.

Support and resistance
In the near future, the continuation of the downward dynamics of quotes seems more likely. After the breakdown of the 0.6055 mark (0.0% retracement, H4; 61.8% retracement, D1), its targets will be 0.5986 (the area of intersection with the oncoming ascending fan, D1) and 0.5908 (61.8% Fibonacci extension, H4). If the price consolidates above the level of 0.6109 (50.0% retracement, D1; the central line of Bollinger Bands, H4), growth may resume to the levels of 0.6163 (38.2% retracement, D1) and 0.6252 (61.8% retracement, H4).
Resistance levels: 0.6109, 0.6163, 0.6252.
Support levels: 0.6055, 0.5986, 0.5908.
Trading tips
Short positions can be opened below the 0.6055 mark with targets of 0.5986, 0.5908 and a stop-loss around 0.6100. Implementation period: 5–7 days.
Long positions can be opened from the level of 0.6109 with targets of 0.6163, 0.6252 and a stop-loss around
风险提示:以上内容仅代表作者或嘉宾的观点,不代表 FOLLOWME 的任何观点及立场,且不代表 FOLLOWME 同意其说法或描述,也不构成任何投资建议。对于访问者根据 FOLLOWME 社区提供的信息所做出的一切行为,除非另有明确的书面承诺文件,否则本社区不承担任何形式的责任。
FOLLOWME 交易社区网址: www.followme.asia


加载失败()