| Scenario | |
|---|---|
| Timeframe | Weekly |
| Recommendation | SELL STOP |
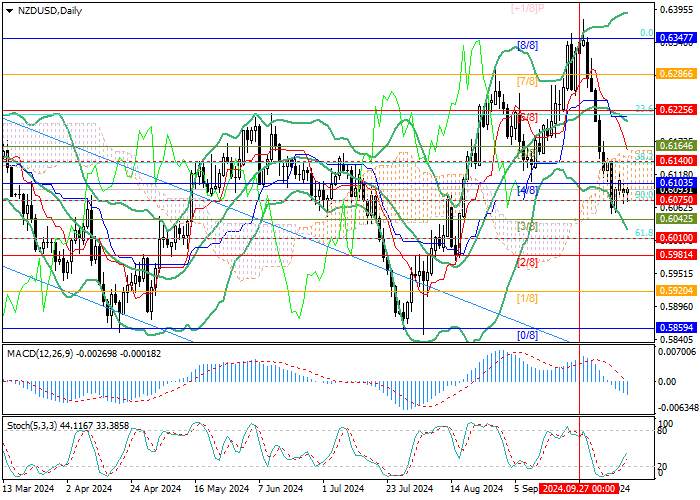
| Entry Point | 0.6070 |
| Take Profit | 0.5981, 0.5920 |
| Stop Loss | 0.6140 |
| Key Levels | 0.5920, 0.5981, 0.6075, 0.6225, 0.6347, 0.6408 |
| Alternative scenario | |
|---|---|
| Recommendation | BUY STOP |
| Entry Point | 0.6230 |
| Take Profit | 0.6347, 0.6408 |
| Stop Loss | 0.6190 |
| Key Levels | 0.5920, 0.5981, 0.6075, 0.6225, 0.6347, 0.6408 |
Current trend
The NZD/USD pair is moving within a short-term downward trend, testing the level of 0.6075 (50.0% Fibonacci correction) under pressure from the Q3 inflation data.
Thus, the consumer price index corrected from 0.4% to 0.7% QoQ and from 3.3% to 2.2% YoY, returning to the target range of the Reserve Bank of New Zealand (2.0–3.0%) for the first time in more than three years. It increases the likelihood of maintaining the monetary easing pace. Most experts believe the regulator will cut the interest rate by another 50 basis points in November.
Meanwhile, the US labor market is recovering (unemployment fell to 4.1%, and the employment rate grew by 254.0K), and inflation is weakening, amounting to 2.4% in September instead of the expected 2.3%. In these conditions, US Fed officials may take a cautious position. Yesterday, the regulator’s representative Christopher Waller said the economy was developing faster than desired, so it is better to slow the interest rate cut pace.
In general, against monetary factors, a decline in the NZD/USD pair in the medium term is very likely.
Support and resistance
The trading instrument is testing 0.6075 (Fibonacci correction 50.0%). After a breakdown, it may fall to 0.5981 (Murrey level [2/8]) and 0.5920 (Murrey level [1/8]). In case of a breakout of the Bollinger Bands’ midline 0.6225 (Murrey level [6/8], Fibonacci correction 23.6%), growth to the area of 0.6347 (Murrey level [8/8]) and 0.6408 (Murrey level [ 1/8]) may follow.
Technical indicators confirm the formation of a downward trend: Bollinger Bands are reversing downwards, and the MACD histogram is increasing in the negative zone. The exit of Stochastic from the oversold zone does not exclude a limited correction.
Resistance levels: 0.6225, 0.6347, 0.6408.
Support levels: 0.6075, 0.5981, 0.5920.

Trading tips
Short positions may be opened below 0.6075, with the targets at 0.5981, 0.5920, and stop loss 0.6140. Implementation period: 5–7 days.
Long positions may be opened above 0.6225, with the targets at 0.6347, 0.6408, and stop loss 0.6190.
风险提示:以上内容仅代表作者或嘉宾的观点,不代表 FOLLOWME 的任何观点及立场,且不代表 FOLLOWME 同意其说法或描述,也不构成任何投资建议。对于访问者根据 FOLLOWME 社区提供的信息所做出的一切行为,除非另有明确的书面承诺文件,否则本社区不承担任何形式的责任。
FOLLOWME 交易社区网址: www.followme.asia


加载失败()