Current trend
During the morning session, the leading index of the London Stock Exchange FTSE 100 is developing the “bullish” momentum formed yesterday and is testing the 8353.5 mark for a breakout, renewing the high of September 19 with the support of British macroeconomic statistics, weakened the pound.
Thus, the September core consumer price index fell from 3.6% to 3.2%, below the forecast of 3.4%. At the same time, the broader indicator fell from 2.2% to 1.7% YoY relative to expectations of 1.9% and from 0.3% to 0.0% versus 0.1% MoM. The non-seasonally adjusted producer price index changed from 0.2% to –0.7% YoY, almost justifying the estimates of –0.6% and –0.3% to –0.5% MoM. Finally, the retail price index slowed from 3.5% to 2.7% YoY, although experts expected 3.1% and 0.6% to –0.3% MoM. Against cooling inflation, analysts are revising their estimates regarding the further actions of Bank of England officials. Today, the regulator may hear the inflation report, supporting the index. Tomorrow at 08:00 (GMT 2), investors will pay attention to the retail sales data. According to forecasts, the value will change from 1.0% to –0.3% MoM and from 2.5% to 3.2% YoY.
Support and resistance
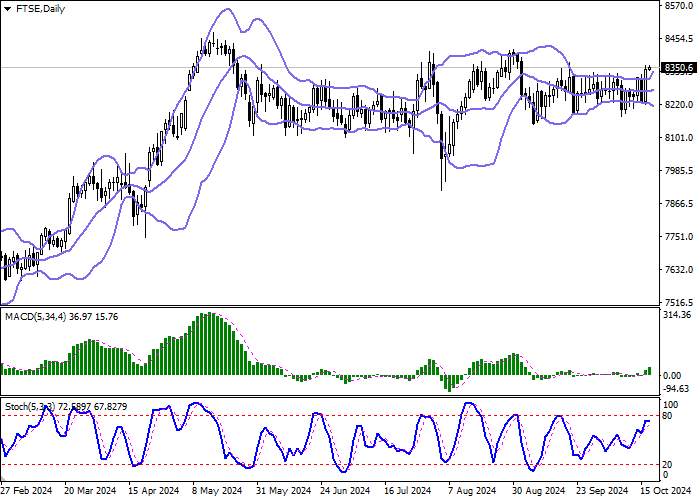
On the daily chart, Bollinger bands are growing slightly. The price range is expanding, failing to keep up with the development of “bullish” sentiment. The MACD indicator is growing, maintaining a buy signal (the histogram is above the signal line). Stochastic, having approached “80”, reversed into a horizontal plane, indicating that the index may become overbought in the ultra-short term.
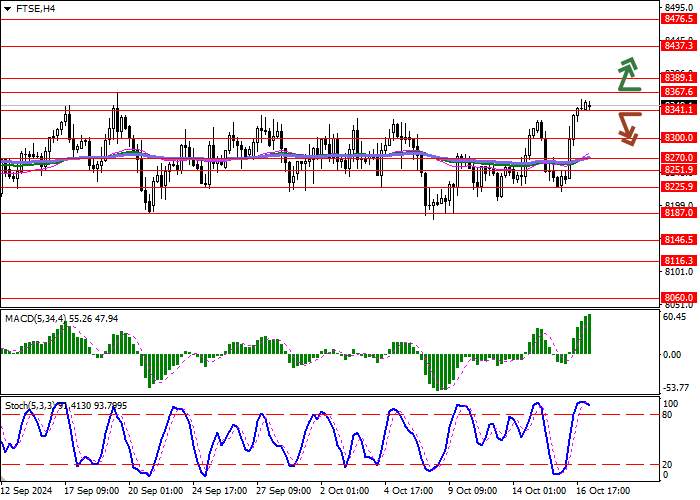
Resistance levels: 8367.6, 8389.1, 8437.3, 8476.5.
Support levels: 8341.1, 8300.0, 8270.0, 8251.9.

Trading tips
Long positions may be opened after a breakout of 8367.6, with the target at 8437.3. Stop loss – 8330.0. Implementation period: 2–3 days.
Short positions may be opened after a breakdown of 8341.1, with the target at 8300.00. Stop loss is 8367.6.


Tải thất bại ()