Current trend
The AUD/USD pair is showing mixed dynamics, trading near 0.6700: the instrument is trying to develop the “bullish” momentum formed the day before, when the Australian dollar managed to retreat from its local lows of September 12 against the backdrop of the publication of macroeconomic statistics.
Thus, the Employment Change in Australia in September added 64.1 thousand after increasing by 42.6 thousand in the previous month, while analysts expected 25.0 thousand, Full-Time Employment increased by 51.6 thousand, and Part-Time Employment — by 12.5 thousand, the Unemployment Rate was fixed at 4.1% contrary to expectations of 4.2%, while the Participation Rate adjusted from 67.1% to 67.2%, ahead of neutral forecasts.
Today, the instrument is receiving some support from data from China: Industrial Production volumes in September accelerated from 4.5% to 5.4%, with preliminary estimates at 4.6%, and Retail Sales — from 2.1% to 3.2%, compared to a forecast of 2.5%. In turn, Gross Domestic Product (GDP) in the third quarter grew by 0.9% after 0.7% quarterly and by 4.6% after 4.7% year-on-year, while experts expected 1.0% and 4.5%, respectively.
Today, at 14:30 (GMT 2), the US will present September data on the housing market: among other things, analysts expect a slowdown in the dynamics of issued Building Permits from 1.47 million to 1.46 million, and the volume of Housing Starts may decrease from 1.356 million to 1.350 million.
Support and resistance
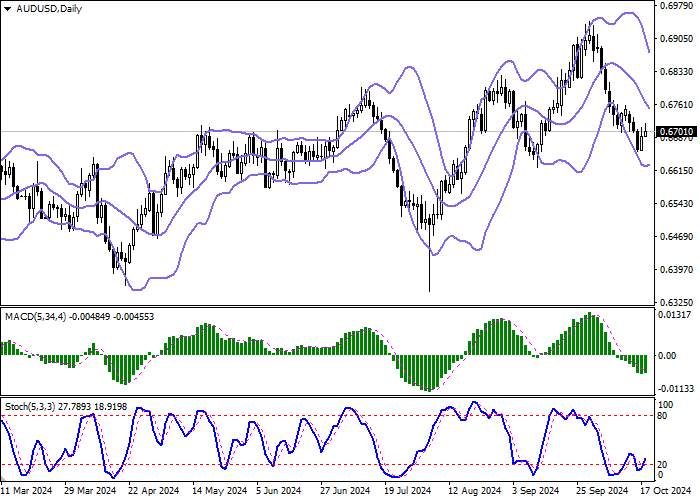
Bollinger Bands on the daily chart show a confident decline: the price range narrows from below, indicating the emergence of a corrective upward trend at the end of the current trading week. MACD is trying to reverse into an upward plane, maintaining the previous sell signal (the histogram is below the signal line). Stochastic shows oscillatory dynamics near the level of “20”, which still signals the existing risks of the Australian dollar being oversold in the ultra-short term.
Resistance levels: 0.6700, 0.6732, 0.6758, 0.6800.
Support levels: 0.6675, 0.6657, 0.6622, 0.6600.


Trading tips
Long positions can be opened after a confident breakout of 0.6732 with a target of 0.6800. Stop-loss — 0.6700. Implementation time: 2-3 days.
A return of the “bearish” dynamics with a subsequent breakdown of 0.6675 may become a signal to open new short positions with a target of 0.6622. Stop-loss — 0.6700.


Tải thất bại ()