Shares of Walmart Inc., an American company that manages the largest network of wholesale and retail trade, are correcting at 81.00.
On the daily chart, the price is moving in an upward trend, being significantly below the resistance line of the channel with dynamic boundaries of 88.00–78.00.
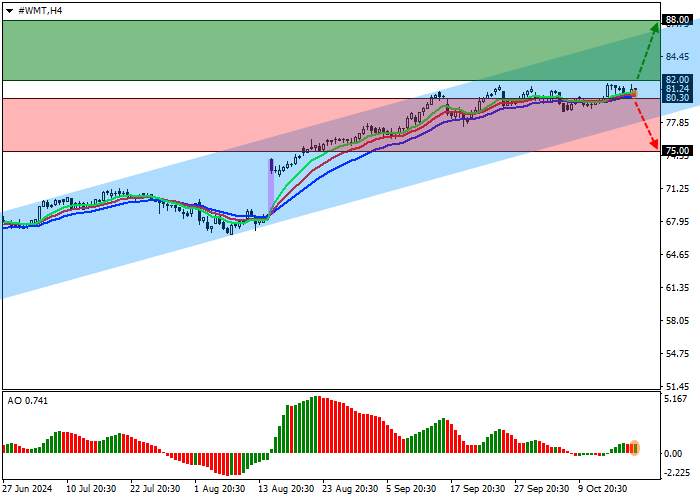
On the four-hour chart, the quotes could not leave the range and break the year’s high of 82.00, tested four times already. If the asset consolidates below the low of 79.00, the channel support line of 77.00 may be reached.
Technical indicators reinforce the upward signal: fast EMAs on the Alligator indicator are above the signal line, moving away from it, and the AO histogram forms correction bars in the purchase zone.
Trading tips
Long positions may be opened after the price consolidates above 82.00 and reaches 88.00. Stop loss is 80.00. Implementation period: 7 days or more.
Short positions may be opened after the price declines and consolidates below 80.30, with the target at 75.00. Stop loss is 82.00.


Tải thất bại ()