Current trend
Last week, the BTC/USD pair continued to grow, and today, it rose above 69500.00 amid an increasing probability of victory in the US presidential race for the Republican candidate Donald Trump, who has declared a loyal position towards digital assets.
Earlier, the official promised to make the US the cryptocurrency capital of the world, approve Bitcoin as one of the reserve assets, replace the head of the US Securities and Exchange Commission (SEC) Gary Gensler, and generally soften the authorities’ attitude towards the sector. Currently, according to the Polymarket platform, the probability of Trump’s election is 60.8%, the highest since July, and experts believe that with such an outcome of the vote, the entire digital asset market will significantly strengthen, and BTC will rise to the region of 90000.00–100000.00 by the end of the year.
Interest in digital assets is confirmed by the stable dynamics of the inflow of funds into the Bitcoin ETF, which amounted to 2.129B dollars last week. Additional support was provided by Friday’s decision by the SEC to allow the New York Stock Exchange (NYSE) and the Chicago Board of Trade (CBOE) to list options on the Bitcoin ETF: trading in new instruments will be available to eleven companies, which will provide the industry with additional liquidity and serve as a catalyst for further strengthening of the quotes.
Support and resistance
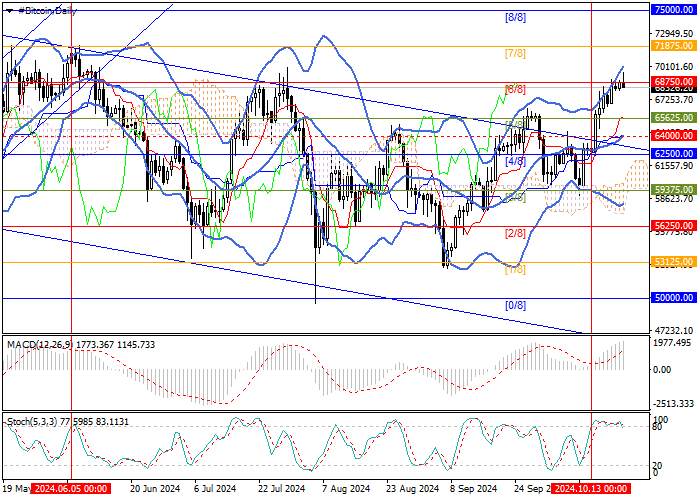
The trading instrument has left the long-term downward channel and is testing 68750.00 (Murrey level [6/8]), consolidation above which will allow it to reach the 71875.00 (Murrey level [7/8]) and 75000.00 (Murrey level [8/8]). In case of consolidation below the middle line of Bollinger Bands 64000.00, a decline to 59375.00 (Murrey level [3/8]) and 56250.00 (Murrey level [2/8]) may follow.
Technical indicators do not give a single signal: Bollinger Bands are reversing upwards, and the MACD histogram is increasing in the positive zone, confirming the formation of a short-term upward trend. However, Stochastic is reversing downwards in the overbought zone, which does not exclude the development of negative dynamics.
Resistance levels: 68750.00, 71875.00, 75000.00.
Support levels: 64000.00, 59375.00, 56250.00.

Trading tips
Long positions may be opened above 68750.00, with the targets of 71875.00, 75000.00, and stop loss of 66700.00. Implementation period: 5–7 days.
Short positions may be opened below 64000.00, with the targets of 59375.00, 56250.00, and stop loss of 67400.00.


Tải thất bại ()