| Scenario | |
|---|---|
| Timeframe | Intraday |
| Recommendation | BUY STOP |
| Entry Point | 34.30 |
| Take Profit | 35.50 |
| Stop Loss | 33.75 |
| Key Levels | 32.60, 33.00, 33.42, 33.75, 34.26, 34.86, 35.50, 36.00 |
| Alternative scenario | |
|---|---|
| Recommendation | SELL STOP |
| Entry Point | 33.70 |
| Take Profit | 33.00 |
| Stop Loss | 34.26 |
| Key Levels | 32.60, 33.00, 33.42, 33.75, 34.26, 34.86, 35.50, 36.00 |
Current trend
The XAG/USD pair is showing moderate growth, correcting after the instrument’s sharp decline the day before, which did not allow it to consolidate at new record highs near 34.85.
Technical factors are putting pressure on quotes, while the macroeconomic and news background changes little. The day before, investors paid attention to statistics on Existing Home Sales in the US: in September, the indicator fell by 1.0% after –2.0% in the previous month, and in absolute terms, sales slowed from 3.86 million to 3.84 million, while analysts expected 3.90 million.
In addition, the focus of attention of traders yesterday was the monthly review from the US Federal Reserve, the Beige Book, according to which economic activity in the country remained virtually unchanged in September-October. Most US Federal Reserve districts reported declines in manufacturing, while the banking sector remained stable or showed slight growth. Activity in the residential property market remained the same, while the lack of affordable housing in many cities remains a serious problem for citizens.
Today at 15:45 (GMT 2), the US will present October business activity data from S&P Global: forecasts suggest a decrease in the Services PMI from 55.2 points to 55.0 points, while the Manufacturing PMI may be adjusted from 47.3 points to 47.5 points.
Support and resistance
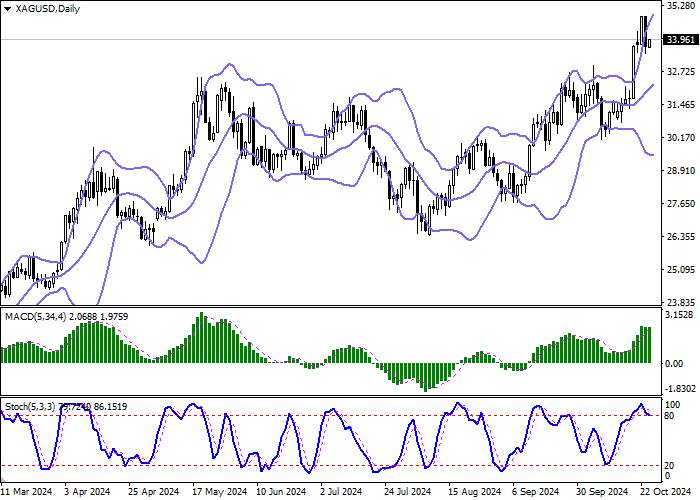
Bollinger Bands on the daily chart show a steady increase. The price range is expanding, but it is difficult to keep up with the surge in "bullish" sentiment in the ultra-short term. MACD indicator is trying to reverse into the descending plane, keeping the previous buy signal (located above the signal line). Stochastic, having rebounded from its highs, maintains a confident downtrend, signaling in favor of the development of full-fledged downtrend in the ultra-short term.
Resistance levels: 34.26, 34.86, 35.50, 36.00.
Support levels: 33.75, 33.42, 33.00, 32.60.


Trading tips
Long positions can be opened after a breakout of 34.26 with the target of 35.50. Stop-loss — 33.75. Implementation time: 2-3 days.
A rebound from 34.26 as from resistance, followed by a breakdown of 33.75 may become a signal for opening of new short positions with the target at 33.00. Stop-loss — 34.26.
风险提示:以上内容仅代表作者或嘉宾的观点,不代表 FOLLOWME 的任何观点及立场,且不代表 FOLLOWME 同意其说法或描述,也不构成任何投资建议。对于访问者根据 FOLLOWME 社区提供的信息所做出的一切行为,除非另有明确的书面承诺文件,否则本社区不承担任何形式的责任。
FOLLOWME 交易社区网址: www.followme.asia


加载失败()