| Scenario | |
|---|---|
| Timeframe | Weekly |
| Recommendation | BUY STOP |
| Entry Point | 593.80 |
| Take Profit | 625.00, 656.25 |
| Stop Loss | 572.00 |
| Key Levels | 500.00, 531.25, 562.50, 593.75, 625.00, 656.25 |
| Alternative scenario | |
|---|---|
| Recommendation | SELL STOP |
| Entry Point | 562.45 |
| Take Profit | 531.25, 500.00 |
| Stop Loss | 585.00 |
| Key Levels | 500.00, 531.25, 562.50, 593.75, 625.00, 656.25 |
Current trend
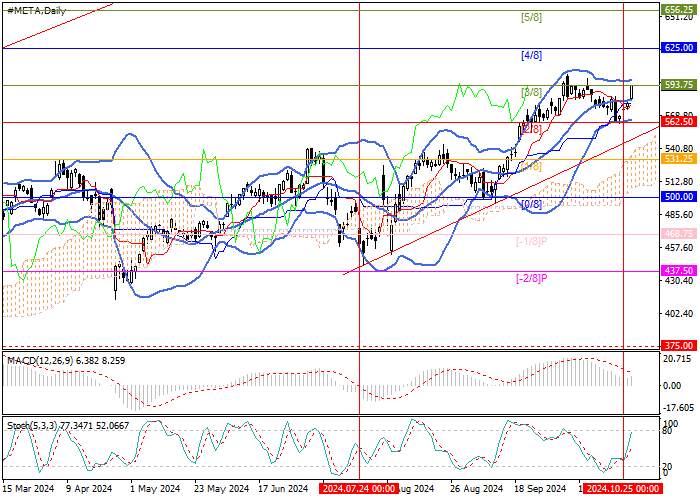
This week, shares of Meta Platforms Inc., an American multinational holding company that owns a technology conglomerate and the largest social network Facebook, resumed growth and are now testing the mark of 593.75 (Murrey level [3/8]): the upward dynamics of the trading instrument is facilitated by positive economic data from the United States, as well as the expectation of the publication of strong financial statements of the emitter for the third quarter.
Yesterday, investors drew attention to consumer confidence statistics for October: the index rose from 99.2 points to 108.7 points, the highest value in the last nine months, confirming the stability of the economy and the likely increase in domestic demand for American companies' products. On Wednesday, investors expect the publication of the Meta Platforms Inc. financial report: against the background of the company's significant success in developing applications based on artificial intelligence (Meta AI, Llama 3.2), sales may increase by 18.0%, which will cause revenue growth to 40.25 billion dollars after 39.1 billion dollars in the second quarter and 34.15 billion dollars over the same period last year. At the same time, profit may amount to 13.56 billion dollars, also above 11.58 billion dollars a year earlier, and earnings per share (EPS) can grow from 5.16 dollars to 5.20 dollars. The implementation of these forecasts is likely to lead to further strengthening of the emitter's shares.
Support and resistance
Technically, the price is testing the 593.75 mark (Murrey level [3/8]), the breakout of which will ensure further growth towards the targets of 625.00 (Murrey level [4/8]) and 656.25 (Murrey level [5/8]). If the level of 562.50 (Murrey level [2/8]), supported by the lower line of Bollinger Bands, is broken down, the downward dynamics can resume to 531.25 (Murrey level [1/8]) and 500.00 (Murrey level [0/8]).
Technical indicators confirm the continuation of the uptrend: Bollinger Bands are horizontal, MACD is increasing in the positive zone, and Stochastic is directed upwards.
Resistance levels: 593.75, 625.00, 656.25.
Support levels: 562.50, 531.25, 500.00.

Trading tips
Long positions can be opened above 593.75 with targets of 625.00, 656.25 and a stop-loss around 572.00. Implementation period: 5–7 days.
Short positions should be opened below the level of 562.50 with targets of 531.25, 500.00 and a stop-loss around 585.00
风险提示:以上内容仅代表作者或嘉宾的观点,不代表 FOLLOWME 的任何观点及立场,且不代表 FOLLOWME 同意其说法或描述,也不构成任何投资建议。对于访问者根据 FOLLOWME 社区提供的信息所做出的一切行为,除非另有明确的书面承诺文件,否则本社区不承担任何形式的责任。
FOLLOWME 交易社区网址: www.followme.asia


加载失败()