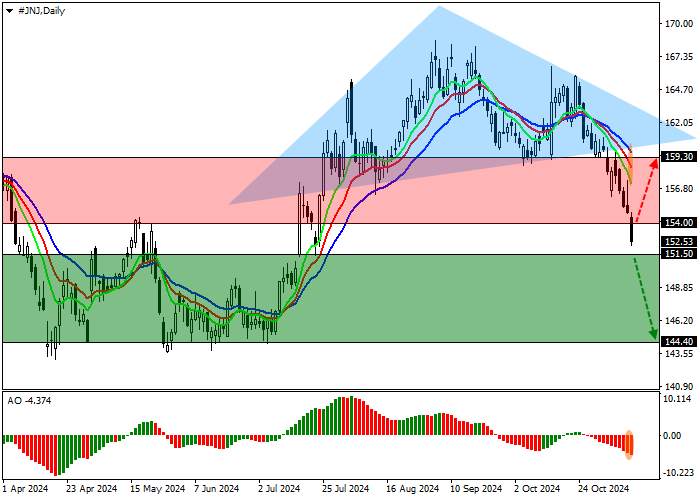
The shares of Johnson & Johnson, one of the leading retail holdings, are correcting at 152.00.
On the daily chart, the price is working out a downward signal from the reversal Head and shoulders pattern with a Neckline at 160.00.
On the four-hour chart, the quotes have almost reached a full pattern implementation level of 150.00. After consolidating below, they may reach the year’s low of 144.00. The development of upward dynamics is likely if the asset returns to the Neckline of the formation and consolidates above it.
Technical indicators are holding the sell signal: the EMA oscillation range on the Alligator indicator is expanding downwards, and the AO histogram is forming correction bars below the transition level.
Trading tips
Short positions may be opened after the price declines and consolidates below 151.50, with the target at 144.40. Stop loss — 155.00. Implementation period: 7 days or more.
Long positions may be opened after the price grows and consolidates above 154.00, with the target at 159.30. Stop loss — 151.00.
Tuyên bố miễn trừ trách nhiệm: Quan điểm được trình bày hoàn toàn là của tác giả và không đại diện cho quan điểm chính thức của Followme. Followme không chịu trách nhiệm về tính chính xác, đầy đủ hoặc độ tin cậy của thông tin được cung cấp và không chịu trách nhiệm cho bất kỳ hành động nào được thực hiện dựa trên nội dung, trừ khi được nêu rõ bằng văn bản.


Tải thất bại ()