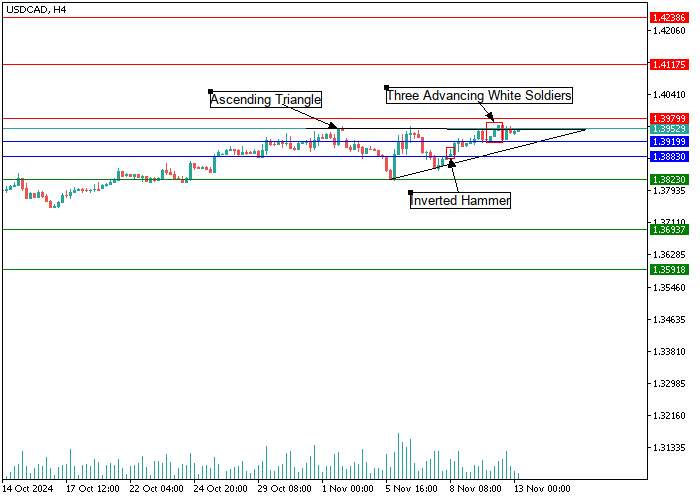
USD/CAD, H4
On the four-hour chart, a large graphical model Ascending Triangle with growing lows and horizontal highs is being built, the exit from which is expected to be upward with a potential target of 1.4117, as well as an Inverted Hammer pattern in the area of the diagonal support line at 1.3883, signaling an upward price reversal. In the area of the key resistance level of 1.3979 and the upper border of the Ascending Triangle pattern, we can identify the Three Advancing White Soldiers trend continuation figure, which once again confirms the strength of the "bulls" in the market, so the instrument will most likely continue its upward dynamics to the area of 1.3979. An impulsive breakout of the upper border of the Triangle pattern by quotes and consolidation above the resistance line of 1.3979 could become a catalyst for opening long positions with targets within the range of 1.4117–1.4238. An alternative scenario is possible if the "bears" lower the price below the key support level of 1.3823, then one should expect an increase in negative dynamics in the region of 1.3693–1.3591.

USD/CAD, D1
The daily chart shows the construction of a large price pattern Bullish Flag, which was broken at the level of 1.3883, and by now the quotes have already tested it and reversed upwards. In the area of 1.3919, variations of the Three White Advancing Soldiers candlestick pattern and Braking model appeared, confirming the growing pressure from sellers. If quotes successfully consolidate above the key resistance level of 1.3979, the upward movement will continue to the area of 1.4117–1.4238.

Support and resistance
Support levels: 1.3823, 1.3693, 1.3591.
Resistance levels: 1.3979, 1.4117, 1.4238.
Trading tips
Long positions can be opened above 1.3979 with targets at 1.4117, 1.4238. Stop-loss — 1.3919. Implementation time: 9-12 days.
Short positions can be opened below the level of 1.3823 with targets at 1.3693, 1.3591. Stop-loss — 1.3883.


Tải thất bại ()