XAU/USD, H4
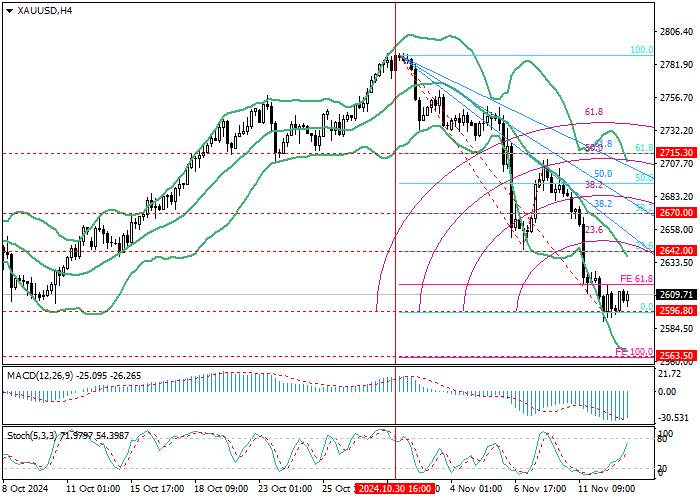
On the four-hour chart, the XAU/USD pair reached a three-month low of 2596.80 (0.0% correction) and is trying to correct to the area of 2642.00 (23.6% correction, middle line of Bollinger Bands) and 2670.00 (38.2% correction). For it, the price has to break the downward fan upwards. If the quotes are consolidated below 2596.80, the negative dynamics will resume to 2563.50 (100.0% expansion).
Technical indicators do not give a single signal: Bollinger Bands are directed downwards, Stochastic is directed upwards, and the MACD histogram is decreasing in the negative zone.

XAU/USD, D1
On the daily chart, the price is correcting against the long-term upward trend, testing 2600.00 (correction 38.2%). Its breakout will allow it to decline to 2541.50 (correction 50.0%). Otherwise, the growth will resume to 2672.00 (correction 23.6%) and 2715.30 (middle line of Bollinger Bands).
Technical indicators allow the asset to decline: Bollinger Bands are reversing upwards, the MACD histogram has moved into the negative zone, and Stochastic, having entered the oversold zone, is directed downwards.

Support and resistance
Soon, the downward movement of the trading instrument may continue, and after breaking through 2596.80 (correction 0.0%, H4), it may reach the area of 2563.50 (expansion 100.0%, H4) and 2541.50 (correction 50.0%, D1). However, in case of a breakout of 2642.00 (correction 23.6%, middle line of Bollinger Bands, H4), growth to the area of 2670.00 (correction 38.2%, H4 and 23.6%, D1) and 2715.30 (correction 61.8%, H4, middle line of Bollinger Bands, D1) is likely.
Resistance levels: 2642.00, 2670.00, 2715.30.
Support levels: 2596.80, 2563.50, 2541.50.
Trading tips
Short positions may be opened below 2596.80, with the targets at 2563.50, 2541.50, and stop loss 2224.00. Implementation period: 5–7 days.
Long positions may be opened above 2642.00, with the targets at 2670.00, 2715.30, and stop loss 2623.00.


Tải thất bại ()