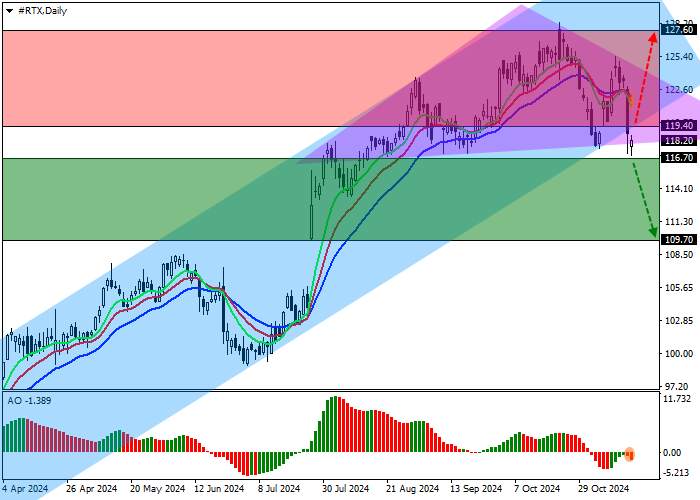
Shares of RTX Corp., an American aerospace and defense conglomerate, are trading at $118.00.
On the daily chart, the price is adjusting from the support line of the ascending channel, with a range of 133.00–118.00.
On the four-hour chart, if the price breaks out of the head and shoulders reversal pattern with the neckline at 118.00, a downtrend is likely to occur. After the onset of the pattern, the main obstacle to the decline will remain at the end of the price gap at 109.70–105.10.
Technical indicators are preparing to reinforce the sell signal: the fast EMA on the Alligator indicator begins to move away from the signal line, and the AO histogram is forming bars in the negative zone.
Trading Tips
Short positions can be opened after the price drops and consolidates below 116.70 with a target of 109.70. Stop loss — 120.00. Execution period: 7 days or more.
Long positions can be opened after the price increases and consolidates above 119.40 with a target of 127.60 stop loss — 116.00.
Tuyên bố miễn trừ trách nhiệm: Quan điểm được trình bày hoàn toàn là của tác giả và không đại diện cho quan điểm chính thức của Followme. Followme không chịu trách nhiệm về tính chính xác, đầy đủ hoặc độ tin cậy của thông tin được cung cấp và không chịu trách nhiệm cho bất kỳ hành động nào được thực hiện dựa trên nội dung, trừ khi được nêu rõ bằng văn bản.
Bạn thích bài viết này? Hãy thể hiện sự cảm kích của bạn bằng cách gửi tiền boa cho tác giả.


Tải thất bại ()