Current dynamics
During the morning session, the USD/CAD pair is recovering from a drop earlier in the week that failed to gain a foothold at the May 2020 highs.
On Friday, data on the dynamics of retail sales put pressure on the US currency positions: in October, the indicator fell from 0.8% to 0.4%, better than the negative forecast of 0.3%, and the value excluding automobiles - from 1.0% to 0.1% against 0.3%, while industrial production changed from -0.5% to -0.3%. Meanwhile, in Canada, wholesale sales accelerated from -0.9% to 0.8% in September, practically justifying preliminary estimates of 0.9%, while manufacturing sales were adjusted from -1.3% to -0.5%. Yesterday, investors drew attention to the growth of housing construction from 223.4 thousand to 240.8 thousand in October, which was better than estimates at 239.0 thousand.
Today at 15:30 (GMT 2) the Canadian consumer price index will be published, which in October may rise by 1.6% to 1.9% on an annual basis and by -0.4% to 0.3% on a monthly basis, but economists believe that the indicator remains on a long-term downward trend. Last month, the driver of the correction was the cost of gasoline against the background of the reduction in oil prices to a minimum of $65.0 per barrel, and experts are confident that the trend will continue in October, although the prices of "black gold" and reached $75.0 per barrel. However, experts from BMO Capital Markets predict that core inflation will be 2.4% or 2.5%: higher taxes will help increase housing values, but it will be offset by lower mortgage costs, as the Bank of Canada lowered interest rates in October. The regulator is likely to adjust borrowing costs by -25 basis points at its meeting on December 11.
Support and resistance levels
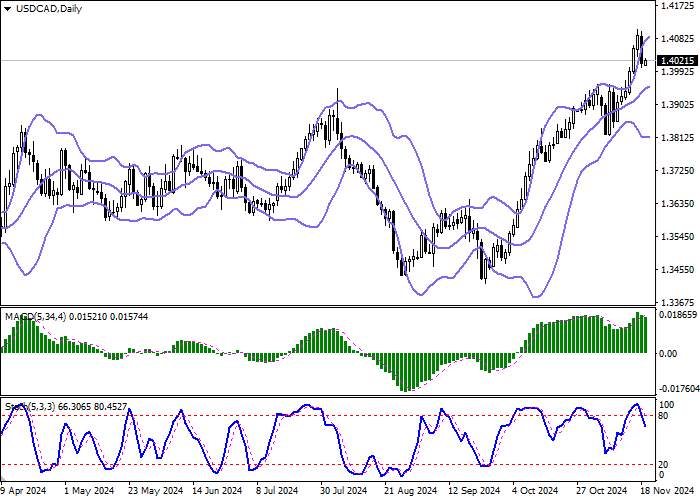
On the daily chart, Bollinger Bands are confidently growing: the price range is expanding, freeing the "bulls" the way to new highs, the MACD indicator is trying to turn into a downward plane, forming a sell signal (the histogram tends to be located below the signal line), and
Stochastic, moving away from the highs, signals in favor of the development of a complete bearish trend in the ultra short term.
Resistance levels: 1.4050, 1.4100, 1.4145, 1.4200.
Support levels: 1.4000, 1.3958, 1.3908, 1.3862.


Business scenarios
Short positions can be opened after the breakout of the level of 1.4000 downwards with the target at 1.3908. Stop-loss — 1.4050. The implementation period is 2–3 days.
Long positions can be opened after a rebound from the level of 1.4000 and a breakout of the level of 1.4050 upwards with the target of 1.4145. Stop-loss — 1.4000.


Tải thất bại ()