| Scenario | |
|---|---|
| Timeframe | Weekly |
| Recommendations | SELL LIMIT |
| Entry point | 2655.00 |
| Take Profit | 2546.00 |
| Stop Loss | 2685.00 |
| Key levels | 2378.00, 2471.00, 2546.00, 2655.00, 2744.00, 2789.00 |
| Alternative scenario | |
|---|---|
| Recommendations | BUY STOP |
| Entry point | 2685.00 |
| Take Profit | 2744.00 |
| Stop Loss | 2660.00 |
| Key levels | 2378.00, 2471.00, 2546.00, 2655.00, 2744.00, 2789.00 |
Current dynamics
The XAU/USD pair reached 2618.00 amid confirmation of Goldman Sachs Group Inc.'s forecast for quotes to rise to 3000.00 next year. The bank named the "dovish" rhetoric of the US Federal Reserve as the main reason for the upward trend: according to the Chicago Mercantile Exchange (CME) FedWatch Tool, the probability of an interest rate adjustment by -25 basis points at the meeting on December 18 is 58.4%, which, in turn, will negatively affect the positions of the national currency, causing the strengthening of assets alternative to it.
Meanwhile, the volume of gold in global exchange-traded funds (ETFs) reached its lowest since early autumn at 83.0 million troy ounces: institutional investors reduced their holdings amid uncertainty following the victory of Republican Donald Trump in the US presidential election, and quotes approached the 2500.00 level, but now the positive trend is supported by purchases of the metal by global central banks and increased demand from Indian jewelers.
A period of local correction has begun on the gold contracts market: according to the latest report from the US Commodity Futures Trading Commission (CFTC), last week the number of net speculative positions decreased from 255.3 thousand to 236.5 thousand. If we pay attention to the dynamics, investors began to actively close purchase transactions, expecting a reversal in quotes: the balance in transactions secured by real money amounted to 218.739 thousand for bulls against 21.377 thousand for bears. Last week, buyers liquidated 20.794 thousand contracts, and sellers opened 3.590 thousand positions.
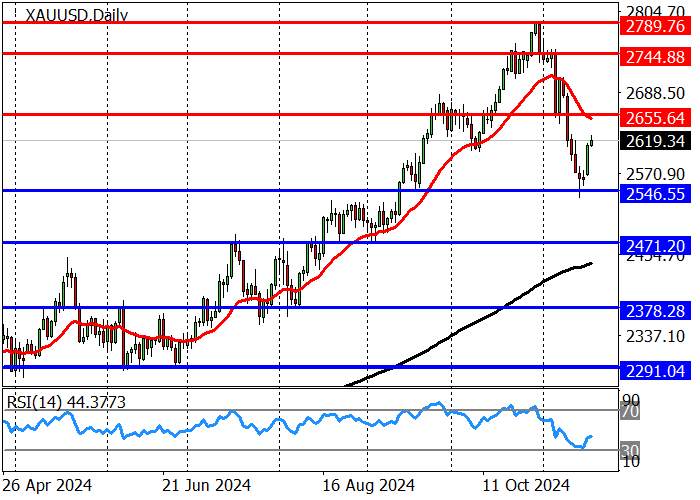
The trading instrument is correcting to a long-term upward trend, having reached the support level of 2546.00 in November, from where growth began to the resistance area of 2655.00 and 2744.00. In case of overcoming the level of 2546.00 downwards, a decline to the area of 2471.00 and 2378.00 is expected. The trend boundary is at the mark of 2290.00.
The medium-term trend changed to a downward trend last week after breaking through the target zone 2680.00–2669.00 and reaching zone 2 (2570.00–2559.00). A correction began here, within which the price may reach the resistance area of 2663.00–2651.00, where short positions with targets of 2600.00 and 2536.00 will become relevant. If the area of 2663.00–2651.00 is overcome upwards, the trend will change to an upward trend towards the area of 2778.00–2766.00.
Support and resistance levels
Resistance levels: 2655.00, 2744.00, 2789.00.
Support levels: 2546.00, 2471.00, 2378.00.


Trading scenarios
Short positions can be opened from the level of 2655.00 with a target of 2546.00 and a stop-loss of 2685.00. Implementation period: 9-12 days.
Long positions can be opened above the level of 2685.00 with a target of 2744.00 and a stop loss of 2660.00.
风险提示:以上内容仅代表作者或嘉宾的观点,不代表 FOLLOWME 的任何观点及立场,且不代表 FOLLOWME 同意其说法或描述,也不构成任何投资建议。对于访问者根据 FOLLOWME 社区提供的信息所做出的一切行为,除非另有明确的书面承诺文件,否则本社区不承担任何形式的责任。
FOLLOWME 交易社区网址: www.followme.asia


加载失败()