Current trend
Shares of Adobe Inc., a leading American software developer, lost 0.77% during the last trading session, while the S&P 500 index rose by 0.39%.
Analysts consider this movement to be a correction against the upward trend. Investors hope for an increase in the company’s profits, which is actively introducing artificial intelligence (AI) technologies into new products. Thus, last week, instruments to simplify the process of editing photos were presented. Vice President of Strategy, Design, and New Products Matthew Smith noted that the project will be in demand in the market since many users prefer not to generate new images but to adapt existing ones for specific purposes.
The quarterly financial report is due on December 11. Experts believe that investments in new technologies will provide Adobe Inc. with positive dynamics in the second half of the year. According to preliminary estimates, earnings per share may amount to 4.66 dollars, 9.13% more than a year earlier, and revenue – 5.54B dollars, up 9.71%. For the year, the values will be 18.28 dollars and 21.44B dollars, higher than in 2023, by 13.75% and 10.46%, respectively.
Support and resistance
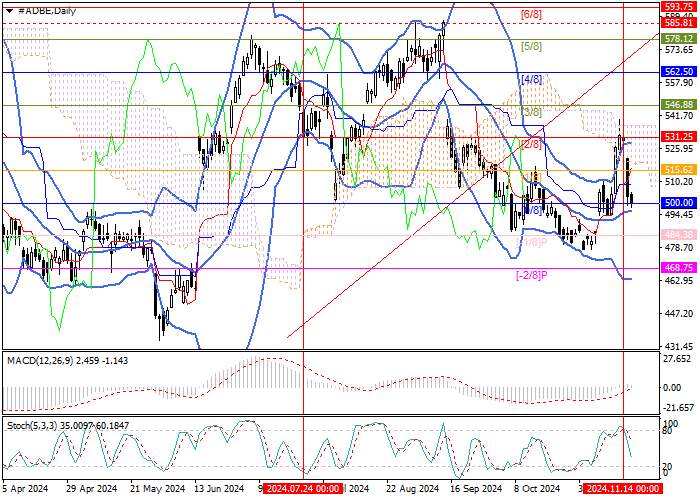
The trading instrument is at the middle line of Bollinger bands 500.00 (Murrey level [0/8]), consolidation below which will allow it to reach the area of 484.38 (Murrey level [–1/8]) and 468.75 (Murrey level [–2/8]). In case of consolidation above 515.62 (Murrey level [6/8]), growth to 546.88 (Murrey level [3/8]) and 562.50 (Murrey level [4/8]) may resume.
Technical indicators do not give a single signal: Bollinger bands reverse upwards, and the MACD histogram is stable in the positive zone. Stochastic reversed downwards, not excluding a limited correction.
Resistance levels: 515.62, 546.88, 562.50.
Support levels: 500.00, 484.38, 468.75.

Trading tips
Long positions may be opened above 515.62 or when the price reverses around 484.38, with the targets of 546.88, 562.50, and stop losses 505.00 and 475.00, respectively. Implementation period: 5–7 days.


Tải thất bại ()