Current dynamics
The AUD/USD pair is correcting in a downward trend at the level of 0.6526: against the background of positive dynamics of the Australian currency and the decline of the US dollar.
Yesterday, the minutes of the Reserve Bank of Australia (RBA) meeting, which took place on November 5, were published: according to officials, high inflation remains the key problem for the national economy, and while the headline figure is on a downward trajectory due to falling fuel prices, the more important core inflation is on an upward trend and will not return to the target range of 1.0-2.0% until 2026 at the earliest, as a result of which the rate of growth of gross domestic product (GDP) remains low. For this reason, the regulator decided to fix the interest rate at 4.35% and continue to implement a contractionary policy until economic conditions become favorable. The experts of the department note that the cost of borrowing should begin to be reduced if consumption is stable and the state of the labor market deteriorates significantly.
The US dollar is holding at 106.10 in USDX after housing data showed building permits in October fell from 1.425 million to 1.416 million, below analysts' forecast of 1.440 million, while housing starts fell 3.1% to 1.311 million units from 1.353 million units previously, compared to expectations of 1.340 million.
Support and resistance levels
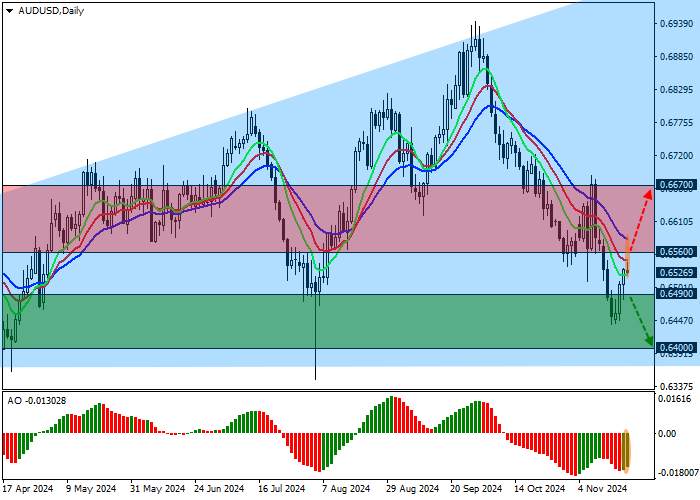
On the daily chart, the trading instrument is correcting above the support line of the “expanding formation” pattern with dynamic boundaries of 0.6980–0.6320.
Technical indicators are slowing down the sell signal: fast EMAs on the Alligator indicator are directed downwards, remaining at a stable distance from the signal line, and the AO histogram is in the negative zone.
Resistance levels: 0.6560, 0.6670.
Support levels: 0.6490, 0.6400.

Trading scenarios
Short positions can be opened after the price declines and consolidates below 0.6490 with a target of 0.6400. Stop loss is 0.6540. Implementation period: 7 days or more.
Long positions can be opened after the price rises and consolidates above the level of 0.6560 with the target of 0.6670. Stop loss is 0.6520.


Tải thất bại ()