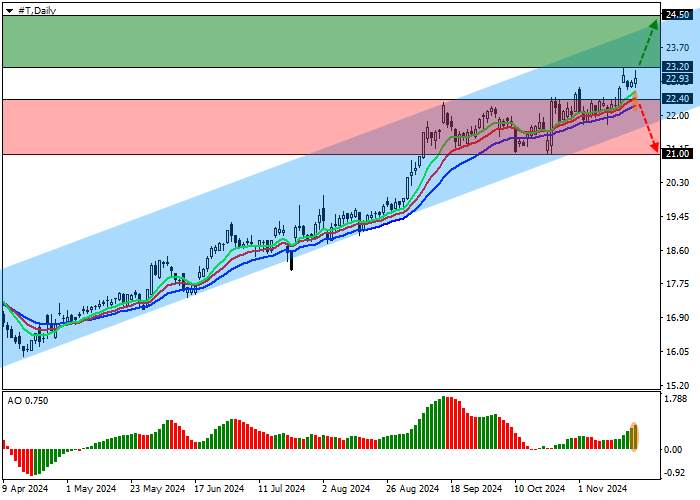
Shares of AT&T Inc., one of the largest US telecommunications companies, corrected at the 23.00 level.
On the daily chart, the price is approaching the resistance line of the ascending channel with dynamic boundaries 24.00-21.00.
On a four-hour timeframe, after holding above the high of 22.50, prices may reach the range resistance line at 24.50. In case of a reversal and decline and consolidation below the recent set of highs around 22.00, the asset will enter a correction phase with a target at the channel support level at 21.00.
Technical indicators maintain a stable buy signal: the fast EMA on the Alligator indicator is moving away from the signal line, and the AO histogram is forming bullish bars in the positive zone.
Trading Tips
Long positions can be opened after the price rises and fixes above the level of 23.20 with a target at 24.50. Stop loss - 22.70. Execution period: 7 days or more.
Short positions can be opened after the price falls and fixes below the level of 22.40 with a target at 21.00. Stop loss - 23.00.
Tuyên bố miễn trừ trách nhiệm: Quan điểm được trình bày hoàn toàn là của tác giả và không đại diện cho quan điểm chính thức của Followme. Followme không chịu trách nhiệm về tính chính xác, đầy đủ hoặc độ tin cậy của thông tin được cung cấp và không chịu trách nhiệm cho bất kỳ hành động nào được thực hiện dựa trên nội dung, trừ khi được nêu rõ bằng văn bản.
Bạn thích bài viết này? Hãy thể hiện sự cảm kích của bạn bằng cách gửi tiền boa cho tác giả.


Tải thất bại ()