Hewlett-Packard Co.: Wavelet Analysis

avatar
· Views 58


Hewlett-Packard Co.: Wavelet Analysis
scenario
Time frameWeekly
RecommendationsBUY STOP
Entry point38.40
profit making41.30
Stop loss37.50
For main levels29.00, 33.00, 34.00, 35.00, 36.60, 37.50, 38.00, 41.30, 42.00
Alternative scenario
RecommendationsSELL STOP
Entry point36.60
profit making33.00
Stop loss37.50
For main levels29.00, 33.00, 34.00, 35.00, 36.60, 37.50, 38.00, 41.30, 42.00

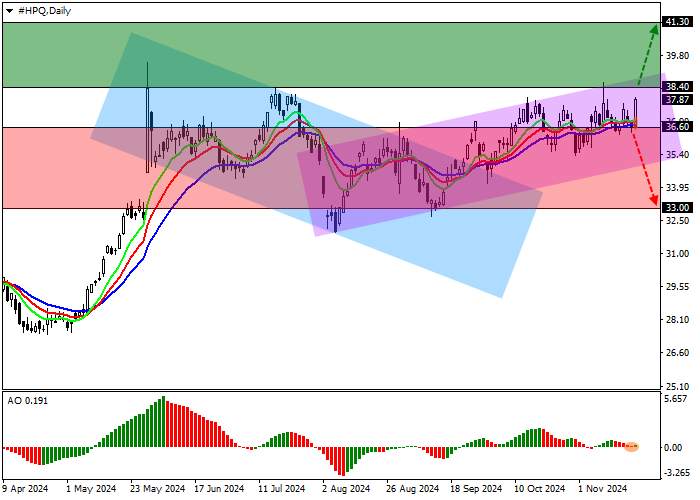
Shares of Hewlett-Packard Co., the US information technology giant, are trading at 38.00.

On the daily chart, the price is correcting significantly above the resistance line of the descending channel 35.00-29.00.

On the 4-hour time frame, the uptrend may continue after prices settle above the interim yearly high at 38.00 with a target at 42.00, however, in case of a reversal and decline, a test of the September low at 34.00 is expected.

Technical indicators are ready to support the bullish signal: the fast EMA on the Alligator indicator is above the signal line, moving away from it, and the AO histogram forms bullish bars above the transition level.

Hewlett-Packard Co.: Wavelet Analysis

Trading Tips

Long deals can be opened after the price rises and fixes above the level of 38.40 with a target of 41.30. Stop loss - 37.50. Execution period: 7 days or more.

Short positions can be opened after the price falls and fixes below the level of 36.60 with a target of 33.00. Stop loss - 37.50.


Tuyên bố miễn trừ trách nhiệm: Quan điểm được trình bày hoàn toàn là của tác giả và không đại diện cho quan điểm chính thức của Followme. Followme không chịu trách nhiệm về tính chính xác, đầy đủ hoặc độ tin cậy của thông tin được cung cấp và không chịu trách nhiệm cho bất kỳ hành động nào được thực hiện dựa trên nội dung, trừ khi được nêu rõ bằng văn bản.

Website Cộng đồng Giao Dịch FOLLOWME: www.followme.asia

Bạn thích bài viết này? Hãy thể hiện sự cảm kích của bạn bằng cách gửi tiền boa cho tác giả.
avatar
Trả lời 0

Tải thất bại ()

  • tradingContest