| Scenario | |
|---|---|
| Timeframe | Intraday |
| Recommendations | SELL STOP |
| Entry point | 106.70 |
| Take Profit | 106.00 |
| Stop Loss | 107.00 |
| Key levels | 105.30, 105.58, 106.00, 106.70, 107.00, 107.50, 108.00, 108.50 |
| Alternative scenario | |
|---|---|
| Recommendations | BUY STOP |
| Entry point | 107.50 |
| Take Profit | 108.50 |
| Stop Loss | 107.00 |
| Key levels | 105.30, 105.58, 106.00, 106.70, 107.00, 107.50, 108.00, 108.50 |
Current dynamics
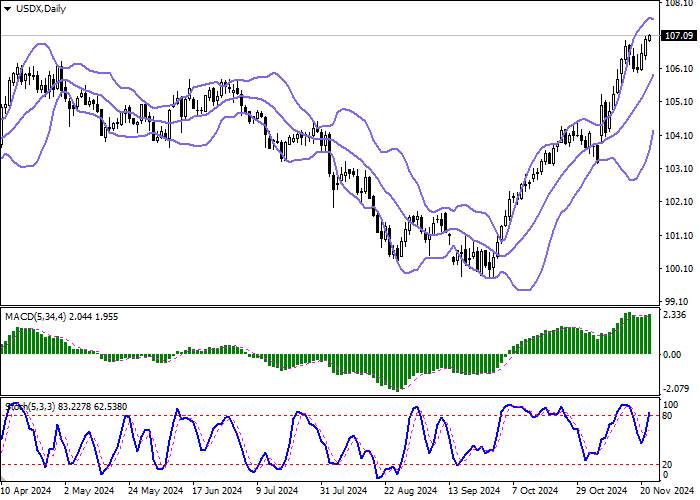
The US dollar index USDX is showing moderate growth during the Asian session on November 22, developing a strong bullish momentum formed during the week, as well as updating the record highs of November 2022: the instrument is testing the 107.10 mark for an upward breakout, while traders are expecting new drivers to emerge.
In particular, today at 16:45 (GMT 2) the US will publish November statistics on business activity: according to forecasts, the index in the services sector from S&P Global will increase from 55.0 points to 55.3 points, and in the manufacturing sector - from 48.5 points to 48.8 points. For now, the market has information on the dynamics of applications for unemployment benefits, which were published the day before: the number of initial applications from citizens for the week of November 15 decreased from 219.0 thousand to 213.0 thousand, while analysts expected 220.0 thousand, and the number of repeated applications for the week of November 8 increased from 1.872 million to 1.908 million with preliminary estimates of 1.870 million. The Philadelphia Federal Reserve Bank (FRB) Manufacturing Business Activity Index, which was also published the day before, sharply decreased in November from 10.3 points to -5.5 points, while experts expected 8.0 points.
In addition, investors hope that the new White House administration led by Donald Trump will offer a plan to end the Russian-Ukrainian conflict: the politician previously promised to end military actions within 24 hours if he was re-elected. However, after the current US President Joe Biden authorized long-range strikes deep into Russian territory from Ukraine, the risks of escalation have increased. A worsening geopolitical situation traditionally increases the attractiveness of the dollar as a relatively safe asset.
Support and resistance levels
Bollinger Bands on the daily chart show confident growth: the price range is narrowing, but remains quite spacious for the current level of activity on the market. MACD is turning towards growth, forming a new buy signal (the histogram is located above the signal line). Stochastic maintains an upward direction, but quickly approaches the maximum marks, indicating the risks of the index being overbought in the ultra-short term.
Resistance levels: 107.00, 107.50, 108.00, 108.50.
Support levels: 106.70, 106.00, 105.58, 105.30.


Trading scenarios
Short positions can be opened after a confident breakout of the 106.70 level downwards with a target of 106.00. Stop loss - 107.00. Implementation period: 2-3 days.
Further development of the “bullish” dynamics with a subsequent breakout of the 107.50 mark upwards may become a signal to open new long positions with a target of 108.50. Stop-loss — 107.00.
Tuyên bố miễn trừ trách nhiệm: Quan điểm được trình bày hoàn toàn là của tác giả và không đại diện cho quan điểm chính thức của Followme. Followme không chịu trách nhiệm về tính chính xác, đầy đủ hoặc độ tin cậy của thông tin được cung cấp và không chịu trách nhiệm cho bất kỳ hành động nào được thực hiện dựa trên nội dung, trừ khi được nêu rõ bằng văn bản.

Để lại tin nhắn của bạn ngay bây giờ