Current dynamics
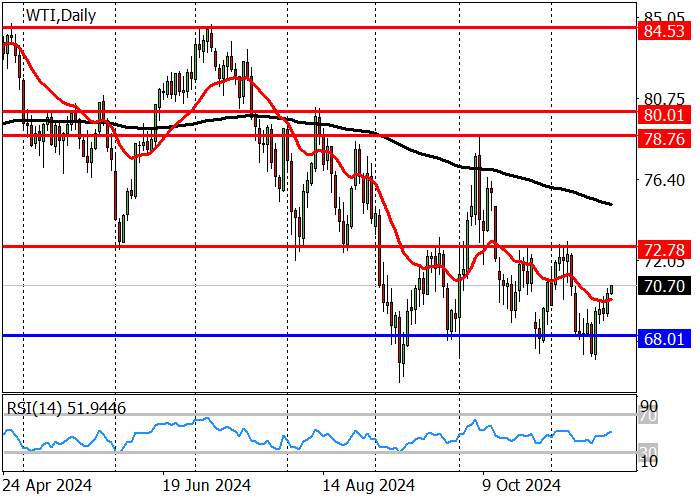
WTI Crude Oil is trading at 70.70, poised to continue its upward trend amid the escalation of the military conflict in Eastern Europe after outgoing US President Joe Biden approved the use of American weapons to destroy targets in Russia. The UK has made a similar decision, and investors are concerned that attacks could damage oil infrastructure. The country produces about 9.0 million barrels of oil per day, despite sanctions and OPEC restrictions: thus, a reduction in supplies from Russia could significantly affect the balance of supply and demand, against which background, quotes have added 5.4% over the week, reaching a maximum since the end of September.
The oil market continues to experience a correction: according to the latest report from the US Commodity Futures Trading Commission (CFTC), last week the number of net speculative positions in WTI Crude Oil decreased from 196.1 thousand to 186.9 thousand. If we look at the dynamics, we can see a slight drop in demand for the asset while the bulls retain their leading positions: their balance among producers was 404.552 thousand against 330.845 thousand among bears. Last week, buyers opened 5.354 thousand deals, while sellers liquidated 0.530 thousand contracts.
The trading instrument is moving in a long-term downtrend, but on smaller charts a channel 72.80–68.00 is forming. This month, the price tested the resistance level of 72.80, dropped to the support level of 68.00 and started growing again: after breaking through the 72.80 mark, the October maximum of 78.75 and the July extreme of 84.50 are expected to be reached. In case of a breakout of the 68.00 area, short positions with a target of 64.00 will become relevant.
The medium-term trend is downward: this week, quotes reached the sell target from the previous key resistance area of 72.91–72.38, updated the October minimum and tested zone 2 (66.84–66.24), where they turned around to 70.70. If the positive dynamics continue, the asset may test the key resistance area of 72.50–71.97, where short positions with the target in zone 2 and zone 3 (60.82–60.22) will become relevant. If the resistance area of 72.50–71.97 is overcome upwards, the trend will change to an upward one, and long positions can be opened with the target in the area of 77.75–77.22.
Support and resistance levels
Resistance levels: 72.80, 78.75, 80.00.
Support levels: 68.00, 64.00, 57.20.


Trading scenarios
Short positions can be opened from the level of 72.80 with a target of 68.00 and a stop-loss of 74.05. Implementation period: 9-12 days.
Long positions can be opened above the level of 74.05 with a target of 78.75 and a stop loss of 72.05.


Tải thất bại ()