Current dynamics
The USDX, which shows the relationship between the US dollar and a basket of world currencies, is correcting after hitting its yearly high of 108.00 amid a relatively weak market reaction to the release of the US Federal Open Market Committee (FOMC) minutes.
According to the document, all members of the department agreed to reduce the interest rate at the recent meeting to the level of 4.50-4.75% in order to maintain economic growth and stimulate production. All monetary policy parameters were maintained, including limits on securities purchases with ceilings of $160.0 billion for repurchase operations and $25.0 billion for treasury securities. Officials suggest that the decision in December will have a key impact on data on the labor market, inflation, and forecasts on the dynamics of growth in key sectors of the economy: the regulator's preliminary plan involves an adjustment of borrowing costs by -25 basis points, which will be finally determined after the publication of reports on the consumer price index in November. However, uncertainty about the future actions of the financial authorities remains: the Chicago Mercantile Exchange (CME) FedWatch instrument estimates that the probability of a minimum decline in the indicator on December 18 has been adjusted from 52.3% to 66.5%.
Growth in the US bond market has stopped, but a significant decline is not yet observed, which allows the asset to hold at current levels: popular 10-year bonds are trading at a yield of 4.298%, which is slightly lower than Monday's rate of 4.412%.
Support and resistance levels
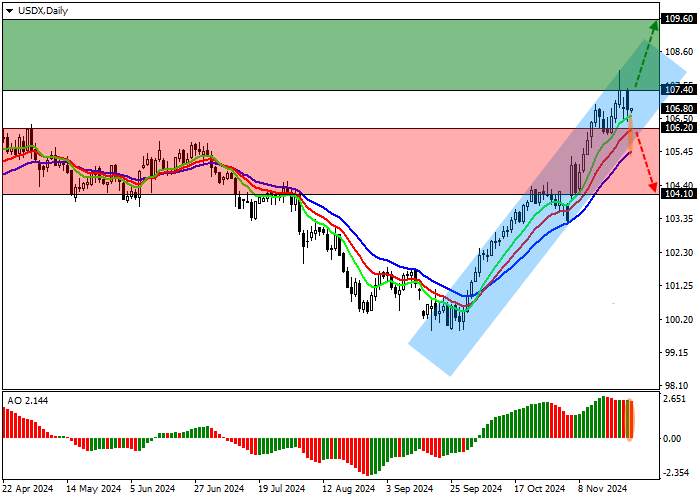
On the daily chart, the trading instrument is correcting sharply below the resistance line of the ascending channel of 108.00–106.00.
Technical indicators reinforce the buy signal: the swing range of the EMA of the "alligator" indicator remains wide, and the AO histogram is forming correction bars above the transition level.
Resistance levels: 107.40, 109.60.
Support levels: 106.20, 104.10.

Business scenarios
Long positions can be opened after the price rises and consolidates above the level of 107.40 with the target of 109.60. Stop loss — 106.50. Implementation period: 7 days or more.
Short positions can be opened after the price declines and consolidates below the level of 106.20 with the target of 104.10. Stop loss — 107.00.


Tải thất bại ()