Starbucks Corp.: technical analysis

avatar
· Views 74


Starbucks Corp.: technical analysis
Scenario
Time frameWeekly
ProposalBUY STOP
Entry Points103.80
Take advantage110.50
Stop-loss101.00
Level lock77.00, 90.90, 97.00, 100.00, 101.00, 102.00, 103.00, 107.00, 110.50
Different scenarios
ProposalSELL STOP
Entry Points100.00
Take advantage91.00
Stop-loss102.00
Level lock77.00, 90.90, 97.00, 100.00, 101.00, 102.00, 103.00, 107.00, 110.50

Shares of Starbucks Corp., one of the largest companies that own the chain of coffee shops of the same name, traded at 102.00.

On the daily chart, the price is correcting, and after the formation of a price gap of 90.90–77.00, a long-term flat develops.

On the four-hour chart, the price is moving in a trend of 107.00–97.00. Despite maintaining upside potential, the asset has yet to break through a key marker for sustained growth — the previous high at 103.00.

Technical indicators strengthen the buy signal: the fast EMA on the Alligator indicator is held above the signal line, expanding the fluctuation range, and the AO histogram forms a correction bar in the positive zone.

Starbucks Corp.: technical analysis

Trading tips

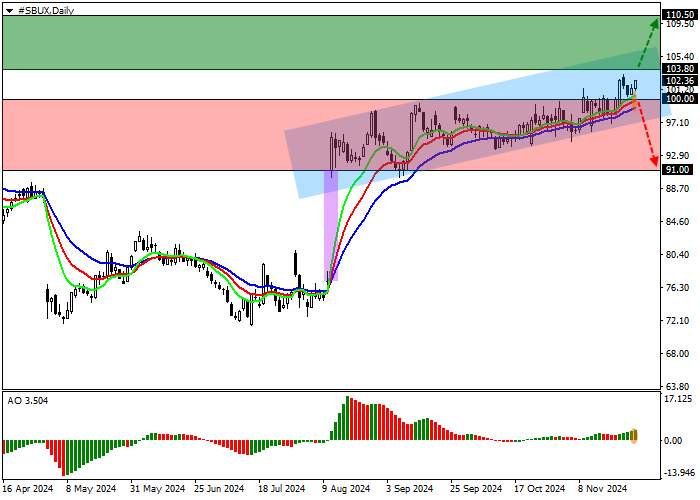
A buy position can be opened after the price rises and strengthens above 103.80, with a target at 110.50. Stop loss at 101.00. Implementation period: 7 days and more.

A sell position can be opened after the price falls and consolidates below 100.00, with a target at 91.00. Stop loss at 102.00.


Tuyên bố miễn trừ trách nhiệm: Quan điểm được trình bày hoàn toàn là của tác giả và không đại diện cho quan điểm chính thức của Followme. Followme không chịu trách nhiệm về tính chính xác, đầy đủ hoặc độ tin cậy của thông tin được cung cấp và không chịu trách nhiệm cho bất kỳ hành động nào được thực hiện dựa trên nội dung, trừ khi được nêu rõ bằng văn bản.

Website Cộng đồng Giao Dịch FOLLOWME: www.followme.asia

Bạn thích bài viết này? Hãy thể hiện sự cảm kích của bạn bằng cách gửi tiền boa cho tác giả.
avatar
Trả lời 0

Tải thất bại ()

  • tradingContest