Current trend
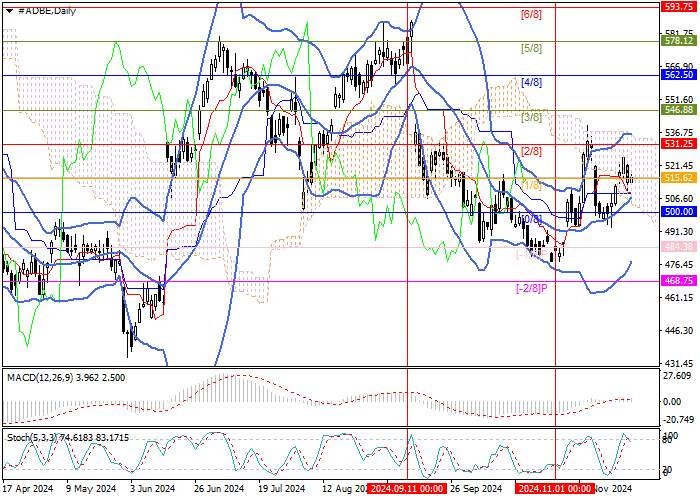
Shares of Adobe Inc., a leading American software developer, have been actively increasing since the beginning of last month, correcting to the medium-term downward trend. The price has reversed from 484.38 (Murrey level [–1/8]), returned to the main Murrey trading range, and is currently close to the key “bullish” level of 531.25 (Murrey level [2/8]). The consolidation above will allow it to reach the central zone of the trading range of 562.50 (Murrey level [4/8]) and 578.12 (Murrey level [5/8]). After a breakdown of 500.00 (Murrey level [0/8]), a decline in the lower reversal zone to the area of 484.38 (Murrey level [–1/8]) and 468.75 (Murrey level [–2/8]) may follow.
Technical indicators do not give a single signal: Bollinger bands are directed upwards, the MACD histogram is stable in the positive zone but Stochastic is reversing downwards from the overbought zone, not excluding the resumption of the downward dynamics.
Support and resistance
Resistance levels: 531.25, 562.50, 578.12.
Support levels: 500.00, 484.38, 468.75.

Trading tips
Long positions may be opened above 531.25, with the targets at 562.50, 578.12, and stop loss 520.00. Implementation period: 5–7 days.
Short positions may be opened below 500.00, with the targets at 484.38, 468.75, and stop loss 510.00.

Để lại tin nhắn của bạn ngay bây giờ